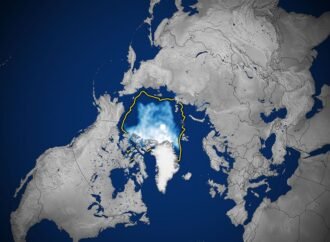
This story is an update to the Arctic sea ice feature in our World of Change series, which tracks long-term change on Earth’s surface through satellite imagery. A layer of frozen seawater caps the Arctic Ocean. This sea ice grows through the long polar winter, usually peaking in March, then melts through the summer to
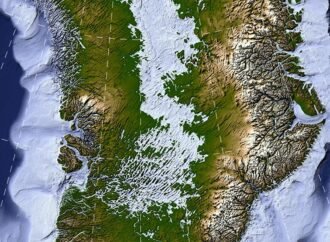
Greenland is capped with a vast ice sheet that spans 1.7 million square kilometers (656,000 square miles) and measures more than 3 kilometers (1.9 miles) at its thickest point. Below all this ice lies a landscape human eyes have never seen directly. But a newly developed method for mapping this hidden bedrock has produced the
NASA’s Earth-observing satellite missions track dozens of features of a changing planet — aerosols, sea levels, land cover, cloud cover — over years and decades. Sustaining that record for the scientific and operational communities who depend on it requires more than engineering talent. It requires planning for an uncertain future: anticipating where a mission delay
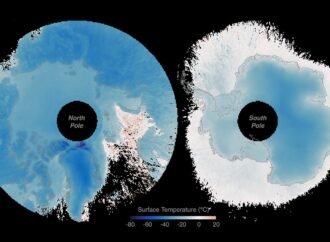
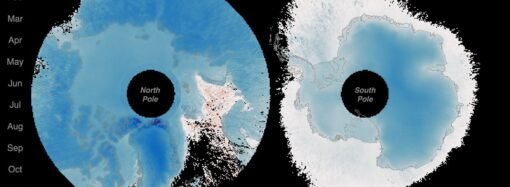
At the top and bottom of the planet, the seasons arrive on a schedule all their own. Satellite data from a mission measuring infrared energy reveal just how differently—and how dramatically—surface temperatures swing across two full years at the poles. In this animation, surface temperatures across the Arctic and Antarctic pulse between cold (dark blue)
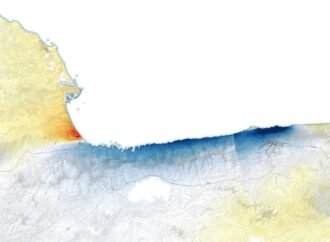
On June 24, 2026, a magnitude 7.2 earthquake struck northern Venezuela, followed less than a minute later by a magnitude 7.5 mainshock. Collectively, the earthquakes left immense damage and loss of life across the region. In the following days, satellite land displacement maps revealed how the Earth’s surface was moving, providing information about the forces