Exploratory biomarker analyses were performed in 190 patients (nivolumab, 98 out of 229 (43%); placebo, 92 out of 232 (40%)) with evaluable paired tumour samples from screening and blood samples from ≥1 time point during the study for whole-exome sequencing (WES). These individuals constituted the biomarker-evaluable population. The most common reasons for exclusion were samples
Exploratory biomarker analyses were performed in 190 patients (nivolumab, 98 out of 229 (43%); placebo, 92 out of 232 (40%)) with evaluable paired tumour samples from screening and blood samples from ≥1 time point during the study for whole-exome sequencing (WES). These individuals constituted the biomarker-evaluable population. The most common reasons for exclusion were samples not passing pathology evaluation, assays not being available and samples failing WES (Extended Data Fig. 1b). Baseline characteristics in the biomarker-evaluable population were generally balanced between treatment groups and similar to those in the all-randomized patient population (Extended Data Table 1).
ctDNA dynamics and pCR status
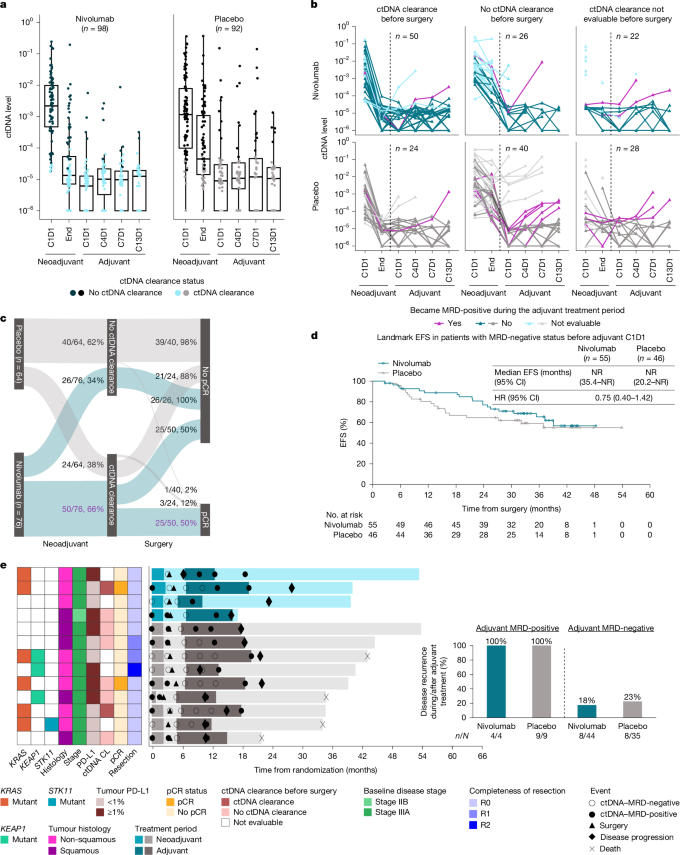
In an exploratory analysis, ctDNA was used to assess ctDNA clearance during the neoadjuvant treatment period and the MRD status during the adjuvant treatment period. All 190 patients in the biomarker-evaluable population had ctDNA-evaluable samples from ≥1 time point during the study (Fig. 1a). Baseline characteristics in patients with detectable ctDNA (nivolumab, 83 out of 98 (85%); placebo, 75 out of 92 (82%)) or no detectable ctDNA (nivolumab, 6 out of 98 (6%); placebo, 12 out of 92 (13%)) before neoadjuvant treatment initiation are reported in Supplementary Table 1. In total, 90 out of 98 (92%) patients in the nivolumab arm and 78 out of 92 (85%) patients in the placebo arm had evaluable ctDNA at neoadjuvant treatment completion. The most substantial decrease in ctDNA levels occurred between neoadjuvant treatment initiation and completion across both treatment groups (Fig. 2a,b). Overall, 140 patients had detectable and evaluable ctDNA before initiation and at completion of neoadjuvant treatment: 76 out of 98 (78%) for the nivolumab group; 64 out of 92 (70%) for the placebo group. Moreover, 63 out of 76 (83%) patients in the nivolumab arm and 60 out of 64 (94%) patients in the placebo arm completed all 4 neoadjuvant treatment cycles (Supplementary Table 2). In the nivolumab group, 50 out of 76 (66%) patients had ctDNA clearance at neoadjuvant treatment completion compared with 24 out of 64 (38%) patients in the placebo group (Fig. 2c). Furthermore, 42 out of 50 (84%) patients in the nivolumab arm and 22 out of 24 (92%) in the placebo arm completed all neoadjuvant treatment cycles (Supplementary Table 2). Baseline characteristics were generally similar regardless of ctDNA clearance status across both treatment groups (Supplementary Table 3). Overall, higher ctDNA levels before neoadjuvant treatment initiation seemed to correlate with higher baseline disease stage and tumour burden (Supplementary Fig. 1a).
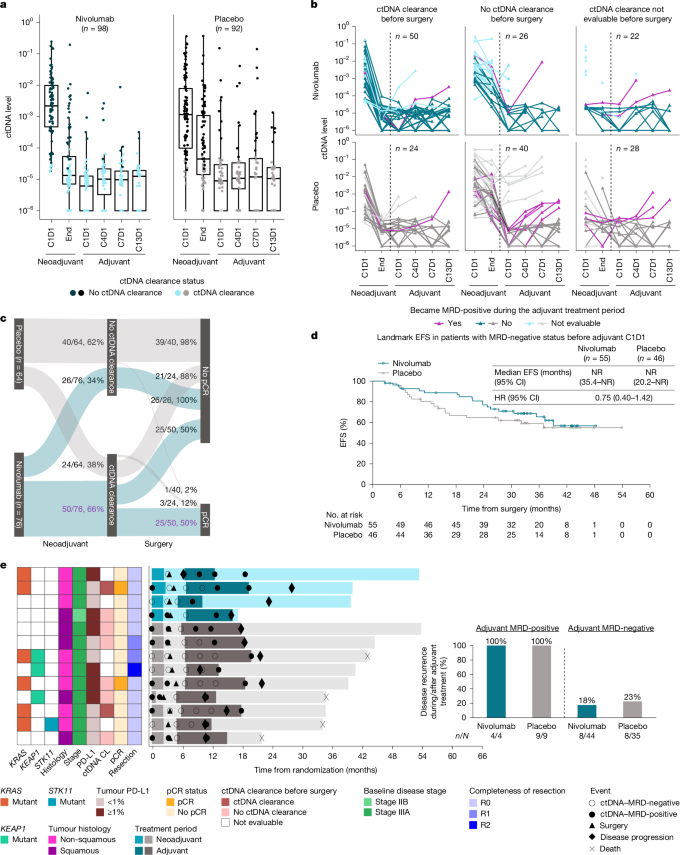
a, Patient-level distribution of ctDNA levels during the neoadjuvant and adjuvant treatment periods in biomarker-evaluable patients. b, ctDNA clearance and MRD status per ctDNA levels in biomarker-evaluable patients. c, Associations between ctDNA clearance and pCR status. d, Landmark EFS from definitive surgery in patients with MRD-negative status before adjuvant C1D1 treatment initiation. e, Baseline characteristics, treatment, clinical outcomes and disease recurrence in patients who became MRD-positive during the adjuvant treatment period (n = 13). In a, each dot represents 1 patient, centre lines of boxes represent medians, upper and lower borders of boxes represent 75th and 25th percentiles, respectively, and upper and lower whiskers span 1.5 times the interpercentile (75th and 25th) ranges from upper and lower bounds of the boxes, respectively; dots not captured in boxes or whiskers (including minima and maxima) represent outliers. In a and b, 10−6 represents ctDNA levels equal to 0. In b and c, ctDNA clearance-status subgroups were defined by ctDNA clearance at neoadjuvant treatment completion. In b, MRD status subgroups were defined by MRD during the last available assessment during the adjuvant treatment period; dashed lines separate neoadjuvant and adjuvant treatment periods. Patients with unevaluable change in MRD status were MRD-negative before adjuvant treatment initiation or did not have evaluable MRD status at ≥1 other time point during the adjuvant treatment period. In c, purple font indicates patients in the nivolumab group who had ctDNA clearance at the neoadjuvant treatment completion and pCR. In b and e, patients with unevaluable ctDNA clearance had no detectable ctDNA before neoadjuvant treatment initiation and/or did not have evaluable ctDNA at neoadjuvant treatment completion. In d, the HR and corresponding two-sided 95% CI were estimated using an unstratified Cox proportional-hazards model with treatment arm as a single covariate. In e, each bar represents one patient. CL, clearance; R0, no residual tumour; R1, microscopic residual tumour; R2, macroscopic residual tumour.
Among patients with ctDNA clearance at neoadjuvant treatment completion, 25 out of 50 (50%) patients in the nivolumab arm had pCR compared with 3 out of 24 (12%) patients in the placebo arm. This finding represents 50% and 12% positive predictive values of ctDNA clearance, respectively (positive likelihood ratios of 2.04 and 2.14, respectively; Supplementary Table 4). In patients without ctDNA clearance, 0 out of 25 (0%) patients in the nivolumab arm had pCR compared with 1 out of 40 (2%) patients in the placebo arm, which represents 100% and 98% negative predictive values of ctDNA clearance, respectively (negative likelihood ratios of 0 and 0.38, respectively). Among patients with evaluable ctDNA clearance and percent residual viable tumour (%RVT), median %RVT was 0% in the nivolumab arm (n = 42) versus 33% in the placebo arm (n = 19) for patients with ctDNA clearance at neoadjuvant treatment completion. By contrast, median %RVT was 50% in the nivolumab group (n = 17) compared with 70% in the placebo group (n = 25) for patients without ctDNA clearance (Supplementary Fig. 1b). Of the patients with ctDNA clearance in the nivolumab arm, 29 (69%) had 0–5% RVT in primary tumour (RVT-PT), 9 (21%) had >5–80% RVT-PT and 4 (10%) had >80% RVT-PT (Supplementary Table 5). For the patients with ctDNA clearance in the placebo arm, these values were 6 (32%) for 0–5% RVT-PT, 9 (47%) for >5–80% RVT-PT and 4 (21%) for >80% RVT-PT. Of the patients without ctDNA clearance in the nivolumab arm, 1 (6%) had 0–5% RVT-PT, 13 (76%) had >5–80% RVT-PT and 3 (18%) had >80% RVT-PT (Supplementary Table 5). These values for the placebo group were 1 (4%) for 0–5% RVT-PT, 15 (60%) for >5–80% RVT-PT and 9 (36%) for >80% RVT-PT.
In the biomarker-evaluable population, 98 patients (nivolumab, 49 out of 98 (50%); placebo, 49 out of 92 (53%)) had evaluable MRD status after surgery and before adjuvant treatment initiation and ≥1 other time point during the adjuvant treatment period. Of these patients, 48 out of 49 (98%) patients in the nivolumab arm and 44 out of 49 (90%) patients in the placebo arm were MRD-negative before adjuvant treatment initiation. By contrast, 1 out of 49 (2%) patients in the nivolumab group and 5 out of 49 (10%) in the placebo group were MRD-positive, none of whom became MRD-negative during the adjuvant treatment period. Among patients who were MRD-negative before adjuvant treatment initiation, 4 out of 48 (8%) patients in the nivolumab arm and 9 out of 44 (20%) patients in the placebo arm became MRD-positive during the adjuvant treatment period. Baseline characteristics by MRD status during the adjuvant treatment period are reported in Supplementary Table 3. Of the four patients in the nivolumab group who became MRD-positive during the adjuvant treatment period, one patient had ctDNA clearance (at neoadjuvant treatment completion), one patient did not have ctDNA clearance and two patients did not have evaluable ctDNA clearance status at neoadjuvant treatment completion. Of the nine patients in the placebo arm who became MRD-positive during the adjuvant treatment period, one patient had ctDNA clearance (at neoadjuvant treatment completion), five patients did not have ctDNA clearance and three patients did not have evaluable ctDNA clearance status at neoadjuvant treatment completion. Of the 4 patients in the nivolumab arm and 8 patients in the placebo arm who were MRD-positive before adjuvant treatment initiation (regardless of whether they had surgery), none became MRD-negative during the adjuvant treatment period, and 3 (75%) and 8 (100%), respectively, had disease recurrence. Figure 1b shows Sankey plots for patients with all evaluable factors for ctDNA dynamics, pCR status and disease recurrence (nivolumab, n = 46; placebo, n = 44). In this subgroup, 1 patient in the nivolumab arm and 5 patients in the placebo arm were MRD-positive after surgery and before adjuvant treatment initiation, and disease recurrence rates were 22% and 45% in the respective treatment groups.
EFS by ctDNA dynamics and pCR status
In patients with definitive surgery, the HR for landmark EFS from definitive surgery for nivolumab versus placebo was 0.87 (95% CI, 0.51–1.47) in patients without pCR. The HR was not calculated in patients with pCR owing to the limited sample size (nivolumab, n = 32; placebo, n = 5; Extended Data Fig. 2a). Similar to analyses in all randomized patients, EFS was longer with nivolumab than with placebo (median, 40.1 months (95% CI, 28.4 to not reached (NR)) versus 15.8 months (95% CI, 10.0–35.1); HR, 0.65 (95% CI, 0.43–0.98)) in biomarker-evaluable patients (Extended Data Fig. 3). Among these patients, the EFS HR for nivolumab versus placebo in patients with detectable ctDNA before neoadjuvant treatment initiation was 0.58 (95% CI, 0.37–0.92; Extended Data Fig. 2b). The HR was not calculated among patients without detectable ctDNA before neoadjuvant treatment initiation owing to the limited sample size (nivolumab, n = 12; placebo, n = 6). The EFS HRs for nivolumab versus placebo were 0.48 (95% CI, 0.22–1.02) in patients with ctDNA clearance before surgery and 0.76 (95% CI, 0.40–1.46) in patients without ctDNA clearance (Extended Data Fig. 2c).
In a composite biomarker analysis of EFS by ctDNA clearance before surgery and pCR status, patients with ctDNA clearance and pCR in the nivolumab group (n = 25) had prolonged EFS compared with patients with ctDNA clearance and no pCR (n = 25; HR, 0.29; 95% CI, 0.10–0.85) and compared with patients with no ctDNA clearance and no pCR (n = 26; HR, 0.23; 95% CI, 0.08–0.65). Among patients with no pCR, the EFS HR for patients with ctDNA clearance versus patients without was 0.70 (95% CI, 0.31–1.59; Extended Data Fig. 4a). For the placebo arm, EFS HRs for comparisons involving patients with ctDNA clearance and pCR were not calculated owing to the limited sample size (n = 3). The EFS HR for patients with ctDNA clearance and no pCR (n = 21) versus patients with no ctDNA clearance and no pCR (n = 39) was 0.77 (95% CI, 0.39–1.54; Extended Data Fig. 4b).
Among patients who were MRD-negative after surgery and before adjuvant treatment initiation, the HR for landmark EFS from definitive surgery with nivolumab versus placebo was 0.75 (95% CI, 0.40–1.42; Fig. 2d). The HR was not calculated among patients who were MRD-positive after surgery and before adjuvant treatment initiation owing to the limited sample size (nivolumab, n = 3; placebo, n = 7). All 13 patients who were MRD-negative after surgery and before adjuvant treatment initiation and became MRD-positive during the adjuvant treatment period had disease recurrence (Fig. 2e).
Tumour genomic alteration analyses
In an additional exploratory analysis, EFS was assessed by KRAS, KEAP1, STK11, SMARCA4, TP53 and CDKN2A tumour alteration status. Among the biomarker-evaluable patients, the frequency of selected tumour alterations was generally similar across both treatment groups. However, KRAS and TP53 mutations were numerically lower and more frequent, respectively, in the nivolumab group than in the placebo group (Supplementary Table 6). KRAS, KEAP1 and STK11 tumour mutations were generally observed in patients with non-squamous NSCLC, whereas TP53 tumour mutations were observed frequently regardless of tumour histology. CDKN2A tumour mutations were generally observed in patients with squamous NSCLC, whereas CDKN2A copy number loss was observed in similar proportions of patients regardless of tumour histology. Across all 190 biomarker-evaluable patients from both treatment groups, the most common single alteration was TP53 mutation (48 patients; 25%), and the most common co-alterations were TP53 mutation with CDKN2A alteration in both groups (38 patients; 20%). The following proportions were observed for other types of alterations: 67 (35%) had KRAS, KEAP1 and/or STK11 tumour mutations, including 3 (2%) with KRAS and KEAP1 co-mutations, 7 (4%) with KRAS and STK11 co-mutations and 3 (2%) with KRAS, KEAP1 and STK11 triple co-mutations; 22 (12%) had KRAS and TP53 co-mutations; and 31 (16%) had TP53 mutations with KEAP1 and/or STK11 co-mutations (Fig. 3a). Surgical outcomes by tumour genomic alteration status are reported in Supplementary Table 7.
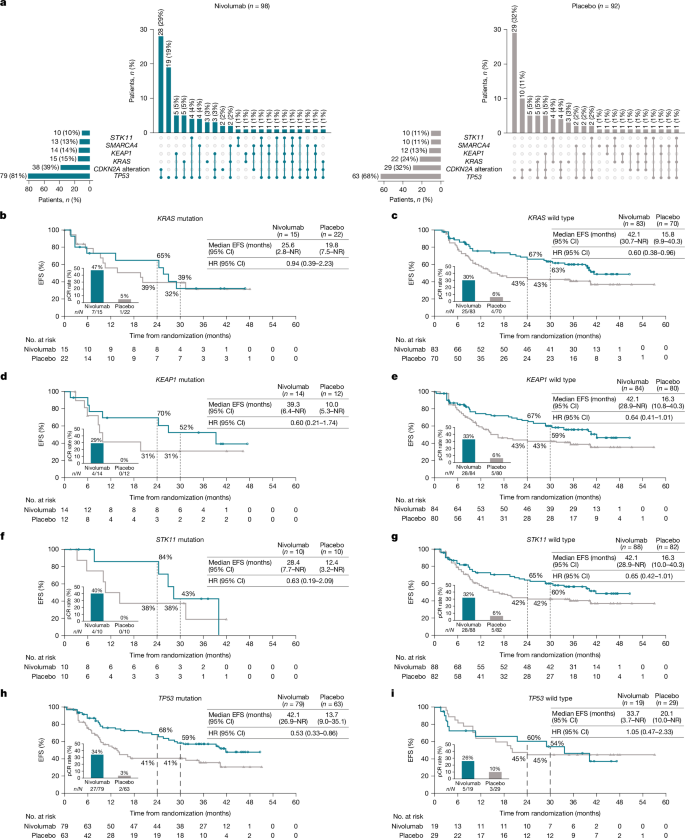
a, Prevalence of KRAS, KEAP1, STK11, TP53 and SMARCA4 tumour mutations and CDKN2A tumour alterations in biomarker-evaluable patients. Tumour genomic alteration status was assessed by WES of pretreatment tumour samples from screening. CDKN2A alteration included CDKN2A mutation and/or homozygous copy number loss. b–i, EFS in patients with the following tumour type: KRAS mutation (b); KRAS wild type (c); KEAP1 mutation (d); KEAP1 wild type (e); STK11 mutation (f); STK11 wild type (g); TP53 mutation (h) or TP53 wild type (i). The line charts follow the same colour code as the bar charts. HRs and corresponding two-sided 95% CIs were estimated using an unstratified Cox proportional-hazards model with treatment arm as a single covariate. The 95% CIs for 30-month EFS rates were as follows: 10–57 (nivolumab) and 18–60 (placebo) (b); 51–73 (nivolumab) and 30–54 (placebo) (c); 23–75 (nivolumab) and 8–59 (placebo) (d); 47–70 (nivolumab) and 31–55 (placebo) (e); 10–73 (nivolumab) and 9–67 (placebo) (f); 48–70 (nivolumab) and 31–53 (placebo) (g); 46–70 (nivolumab) and 28–54 (placebo) (h); and 29–74 (nivolumab) and 26–62 (placebo) (i).
EFS by KRAS, KEAP1, STK11 or TP53 tumour mutational status is shown in Fig. 3b–i. Among patients in the nivolumab arm, pCR was observed in 7 (47%) patients with KRAS tumour mutations, 4 (29%) with KEAP1 tumour mutations, 4 (40%) with STK11 tumour mutations and 27 (34%) with TP53 mutations. Among patients in the placebo group, pCR was observed in 1 (5%) patient with KRAS tumour mutations, no patients with KEAP1 tumour mutations, no patients with STK11 tumour mutations and 2 (3%) patients with TP53 mutations. EFS by CDKN2A (mutation and/or copy number loss) or SMARCA4 tumour alteration status is shown in Supplementary Fig. 2.
EFS seemed longer with nivolumab than with placebo in patients with single or co-alterations in of KEAP1, STK11, CDKN2A and/or SMARCA4 in the tumour (HR, 0.48; 95% CI, 0.28–0.83). The EFS HR in patients with no alterations in these 4 genes was 0.90 (95% CI, 0.48–1.69; Extended Data Fig. 5a,b). The univariate HRs for patients with single or co-alterations in ≥1 of these 4 genes versus patients without alterations in any of these 4 genes were 0.91 (95% CI, 0.50–1.69) with nivolumab and 1.77 (95% CI, 1.01–3.11) with placebo. Multivariate HRs, accounting for smoking status, disease stage, tumour histology, tumour PD-L1 expression and tumour mutational burden (TMB), were 0.99 (95% CI, 0.53–1.86) with nivolumab and 1.82 (95% CI, 1.01–3.30) with placebo. EFS seemed longer with nivolumab than with placebo in patients with TP53 tumour mutations and without KEAP1 or STK11 co-mutations (HR, 0.55; 95% CI, 0.32–0.95; Extended Data Fig. 5c,d). The EFS HR in patients with TP53 tumour mutations and KEAP1 and/or STK11 co-mutations was 0.44 (95% CI, 0.16–1.24; Extended Data Fig. 5e). Patient characteristics, tumour genomic alterations, treatment status and clinical outcomes in all biomarker-evaluable patients are reported in Supplementary Fig. 3.
Of the 190 biomarker-evaluable patients, 98 (nivolumab, 51 out of 98 (52%); placebo, 47 out of 92 (51%)) had baseline TMB < 10 mutations per Mb and 92 (nivolumab, 47 out of 98 (48%); placebo, 45 out of 92 (49%)) had baseline TMB ≥ 10 mutations per Mb. EFS HRs for nivolumab versus placebo were 0.65 (95% CI, 0.39–1.11) among patients with baseline TMB < 10 mutations per Mb and 0.62 (95% CI, 0.32–1.20) among patients with baseline TMB ≥ 10 mutations per Mb (Supplementary Fig. 4).
Predictive modelling
To identify potential predictive markers of EFS outcomes, a random survival forest machine-learning model was trained using data from 80% of biomarker-evaluable patients in the nivolumab arm and placebo arm and tested using data from the remaining 20% of biomarker-evaluable patients to evaluate associations between key clinical and genomic markers (for example, baseline demographic and disease characteristics, pCR, ctDNA clearance and tumour genomic alterations) and EFS. The model that used training data from all biomarker-evaluable patients had a Harrell’s concordance index of 0.79, which indicated that risk scores assigned by the model correlated well with the likelihood of an EFS event. By contrast, the model that used test data had a Harrell’s concordance index of 0.65. The most predictive factors for reduced risk of EFS events included ctDNA clearance before surgery, non-N2 NSCLC, pCR, squamous tumour histology and treatment with nivolumab (Supplementary Fig. 5a). SMARCA4 mutation, CDKN2A alteration and KEAP1 mutation had relatively less value on predicting EFS outcomes in this model using biomarker-evaluable patients from both treatment groups. In a model using only patients who received nivolumab, the most useful predictors for reduced risk of EFS events in order of decreasing magnitude included pCR, high TMB, high tumour PD-L1 expression, non-N2 NSCLC and ctDNA clearance before surgery (Supplementary Fig. 5b). EFS risk-score tertiles were calculated in the training population and applied to the test population. Clear separations were observed between the Kaplan–Meier curves for the predicted high-risk, medium-risk and low-risk groups among all biomarker-evaluable patients but not among biomarker-evaluable patients in the nivolumab arm only (Supplementary Fig. 5c,d).
Keep following us for the latest insights.