Molecular cloning Coding sequences for the near full-length NPR1 (amino acids 40–564; AT1G64280), NPR3 (amino acids 33–561; AT5G45110), NPR4 (amino acids 30–552; AT4G19660), MED15A-FL (amino acids 1–1,335; AT1G15780), MED15A-KIX (amino acids 17–98; AT1G15780), MED15A-KIX long (amino acids 1–98), MED15E-KIX (amino acids 1–75; AT2G10440), MED15D-FL (amino acids 1–189; AT1G15790), MED15D-KIX (amino acids 1–93), NIMIN1-FL (amino acids
Molecular cloning
Coding sequences for the near full-length NPR1 (amino acids 40–564; AT1G64280), NPR3 (amino acids 33–561; AT5G45110), NPR4 (amino acids 30–552; AT4G19660), MED15A-FL (amino acids 1–1,335; AT1G15780), MED15A-KIX (amino acids 17–98; AT1G15780), MED15A-KIX long (amino acids 1–98), MED15E-KIX (amino acids 1–75; AT2G10440), MED15D-FL (amino acids 1–189; AT1G15790), MED15D-KIX (amino acids 1–93), NIMIN1-FL (amino acids 1–142; AT1G02450), NIMIN1-NTD (amino acids 1–108), NIMIN1-αH long (amino acids 31–72), NIMIN1-αH short (amino acids 36–68), NIMIN1-CTD (amino acids 109–142) and TGA3 (amino acids 87–384; AT1G22070) were amplified from the A. thaliana cDNA library with primers pairs that contain linker sequences at the 5′ ends for T4 DNA polymerase (NEB) treatment (forward: 5′-AAAACCTCTACTTCCAATCG-3′, reverse: 5′-CCACACTCATCCTCCGGTTA-3′) for ligation-independent cloning. To generate the Avi-tagged MED15A-KIX, MED15A-KIX (amino acids 17–98) was synthesized with an Avi tag followed by a GSGSGSGS linker at the 5′ by Integrated DNA Technologies and fused after the TEV cleavage site. The loop-deletion NPR1-SBD (amino acids 415–564 with amino acids 460–483 replaced with a GSGSG linker) and the mammalianized MBP (mMBP)51 were synthesized by Azenta/Genewiz. The mMBP–NPR1-SBD fusion construct, where mMBP was used as a crystallization chaperone, was generated by fusing the loop-deletion NPR1-SBD to the last α-helix of mMBP through overlap PCR with a linker sequence encoding five alanine residues (A5) between the two52. The NPR1 and MED15A-KIX mutant inserts were made either through overlap PCR or using the Q5 Site-Directed Mutagenesis Kit (New England Biolabs). For His–MBP-tagged constructs, the inserts were cloned into the pAL vector for Escherichia coli expression system or into HTB vector for insect cell. For His–Venus, the pACE vector that was modified for expressing in both E. coli and the insect cell systems was used. For His–Msb (E. coli acidic protein msyB)53, a pET vector was used. T4 DNA polymerase-treated inserts were incubated with T4 DNA polymerase-treated vectors at a 2:1 molar ratio at room temperature for 5 min before transformation into DH5α-competent or Stbl3-competent cells. For all constructs, the inserts were fused with a 6×His tag followed by a MBP, Venus or Msb protein and a TEV cleavage site at the N terminus. Plasmids were miniprepped with Qiagen miniprep kit following the manufacturer’s instructions and confirmed via Sanger sequencing or whole-plasmid sequencing at Genewiz (Azenta). Positive plasmids were either transformed into BL21-competent cells for expression in E. coli or into DH10Bac cells for bacmids. For insect cell expression, DH10Bac cells were cultured in LB overnight at 37 °C before being resuspended, lysed and then neutralized with 250 µl of P1, 250 µl of P2 and 350 µl of N3 buffers from the Qiagen miniprep kit, respectively. The mixture was incubated on ice for 10 min before being centrifuged at top speed for 10 min. The supernatant was mixed with equal volume of 2-propanol and incubated on ice for 30 min before centrifuging for 15 min at room temperature. The resulting pellet was washed with 500 µl of 70% ice-cold ethanol twice, air dried and eventually dissolved in 40 µl of ddH2O. Recombinant virus was made using Sf9 monolayer cells (Thermo Fisher Scientific, Gibco), and proteins were expressed in Hi5 monolayer cells (Thermo Fisher Scientific, HighFive) in the baculovirus expression vector system (Invitrogen).
Protein expression and purification
E. coli cells expressing the target proteins were cultured at 37 °C to optical density at 600 nm (OD600) of 0.8–1 and induced with 0.2–0.5 mM IPTG at 16 °C overnight. Cells were harvested by centrifugation at 3,000g, resuspended and lysed in lysis buffering (200 mM NaCl, 20 mM Tris HCl pH 8, 0.5 mM TCEP and 20 mM imidazole pH 8) and 1 mM PMSF by sonicating with 30% amplitude, 0.5 s ON–0.5 s OFF for 5 min. The sonicated crude was then centrifuged at 39,375g for 50 min at 4 °C. The supernatant or lysate was loaded on a column that contained 2 ml of nickel or amylose resin and was pre-equilibrated with lysis buffer. After being washed with lysis buffer, protein on the resin was eluted with lysis buffer containing either 200 mM imidazole (for nickel resin) or 10 mM maltose (for amylose resin). The eluted protein was mixed with 4× Laemmli buffer (277.8 mM Tris-HCl, pH 6.8, 44.4% (v/v) glycerol, 4.4% SDS and 0.02% bromophenol blue) and confirmed on an SDS–PAGE gel and by TEV cleavage. Purification procedures for proteins expressed in insect cell were the same as above with a few modifications. Insect cells were pelleted by centrifugation at 2,000g for 15 min, resuspended and lysed in the same lysis buffer supplemented with 1 mM PMSF and protease inhibitors including leupeptin, aprotinin and pepstatin. The elution was then concentrated, centrifuged at top speed at 4 °C for 10 min before size exclusion using Superdex 200 increase 10/30 gl (Cytiva) in sizing buffer (150 mM NaCl, 20 mM HEPES pH 7.5 and 0.5 mM TCEP). Unless otherwise stated, NPR1 (amino acids 40–564) and MED15A-KIX (amino acids 17–98) were used in this study.
In vitro pulldown assays
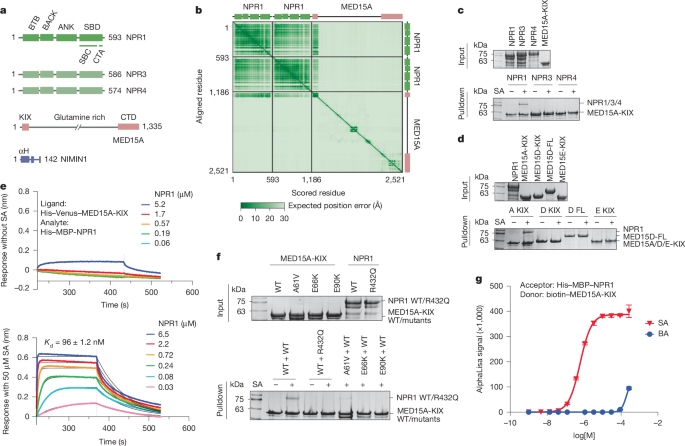
To detect the interaction between MED15s and NPRs, His–MBP–MED15s and His–Venus–NPRs were expressed in E. coli separately as described above. As His–Venus-tagged NPRs were associated with multiple proteolytic products, to control the amount of the input proteins for the pulldown experiments, 4 µg of each protein was run on an SDS–PAGE gel to calculate the percentage of the intact protein in the sample. The bands of the intact proteins were quantified with the Image Lab (v5.1) software (Bio-Rad). The concentration of the intact proteins was calculated accordingly. A total of 20 µg of His–MBP–MED15 was mixed with His–Venus–NPR at a 1:2 molar ratio with or without 200 µM SA and incubated on ice for 20 min. The mixture was then applied to 20 µl amylose resin (NEB) that was pre-equilibrated with sizing buffer, gently mixed and incubated on ice for 1 h. The supernatant was removed after centrifugation at 600g for 1 min. The resin was washed three times with 200 µl of sizing buffer. To elute, the resin was resuspended with 40 µl of 1× sample buffer and boiled at 100 °C for 10 min. After centrifugation at top speed for 1 min, the supernatant was collected and loaded on an SDS–PAGE gel that was run in 1× Rapid Running Buffer Solution (Nacalai Tesque) at 210 V for 25 min. For gel source data, see Supplementary Fig. 1.
For the pulldown experiment involving full-length NPR1 and various NIMIN1 constructs, His–MBP–NPR1 was used to pull down His–Venus–NIMIN1s. In the experiment assessing the interaction between NIMIN1 αH and various NPR1 constructs, the His–MBP-tagged NIMIN1-αH long (amino acids 31–72) was co-expressed with His–Msb-tagged NPR1-FL, NPR1-BTB-ANK or NPR1-SBD and purified with amylose resin. In the experiment in which the interaction between NPR1-SBD and MED15A-KIX or NIMIN1-αH long (amino acids 31–72) was examined, His–mMBP-tagged NPR1-SBD was used to pull down His–Venus-tagged MED15A-KIX or His–Venus-tagged NIMIN1-αH long. To pull down the MED15A-FL, His–MBP–NPR1 and His–Venus–MED15A were expressed together in the insect cell. The co-expression samples were assessed side by side with the two separately expressed proteins. For the SA-treated samples, 200 µM SA was included in buffers throughout the pulldown assays. For in-gel Venus florescence detection, protein samples were incubated in 1× sample buffer at room temperature for 5 min, and unboiled samples were loaded to the SDS–PAGE gel; before Coomassie blue staining, Venus fluorescence was detected with DyLight 488 Blot, and protein ladder was imaged with DyLight 680 Blot using the Image Lab Touch software (v3.0.1.14) built in the ChemiDoc MP imaging system (Bio-Rad).
Biolayer interferometry
The binding between NPR1 and MED15A-KIX with or without SA was detected using Octet Red 96 (ForteBio, Pall Life Sciences). The Octet streptavidin biosensors (Sartorius, for kinetics) were equilibrated in buffer for 60 s, pre-activated with 100 nM biotinylated Venus nanobody for 20 s and quenched with 200 nM biocytin for 60 s. His–Venus-tagged MED15A-KIX (200 nM) was then immobilized on the Venus nanobody-coated biosensors for 22 s. After being rinsed in buffer for 60 s, the MED15A-KIX-loaded biosensors were then dipped into a serial dilution of His–MBP–NPR1 purified from insect cell or His–mMBP–NPR1-SBD with or without SA for association and back to buffer for dissociation. All reactions were carried out at 30 °C in a Greiner black 96-well microplate containing 200 μl of sizing buffer containing 0.02% Tween-20 and 0.1% ovalbumin. The buffer-only well served as the instrument internal control, and the MED15A-KIX-absent well was the reference. Data collection was done using the Octet BLI Discovery software (v13.0.3.26). The dissociation constant between MED15A-KIX and NPR1 was determined from the steady-state equilibrium responses using the Octet BLI Analysis (v12.2).
AlphaLISA binding assays
ALPHA was carried out in a Revvity 96-well white 1/2 area microplate sealed with a clear adhesive microplate seal (Revvity TopSeal-A PLUS). Plates were read using a PerkinElmer EnSpire 2300 Multilabel Reader. All the incubation was done with constant shaking at room temperature. His–MBP–NPR1 purified from insect cell was immobilized on the AlphaLISA 6His Nickel Chelate Acceptor Beads (Revvity), whereas the biotinylated MED15A-KIX or biotinylated NIMIN1-αH peptide (amino acids 36–68, biotin-EDEEEEEEKKIDTFFKLIKHYQEARKRRREELA) was captured on the Alpha Streptavidin Donor Beads (Revvity). Avi-tagged MED15A-KIX was biotinylated as previously described54. A cross-titration was performed for each pair (NPR1–MED15A-KIX or NPR1–NIMIN1-αH) before competition assays. Specifically, each protein of a pair was cross-titrated with serial dilutions from the high pM range to 1 µM. The optimal low concentration for each protein was determined to avoid the hooking effect in the following titration assays. The NPR1–MED15A-KIX cross-titration was carried out in the presence of 50 µM SA. For all cross-titrations, the two proteins were mixed first with shaking at room temperature for 1 h followed by a 1-h incubation with 10–20 µg µl−1 acceptor beads, and finally with a 1-h incubation with 10–20 µg µl−1 donor beads in the dark in a 40–50-µl reaction system. The reaction buffer contained sizing buffer, 0.02% Tween-20 and 0.1% bovine serum albumin. Plates were read 1 h after all components were added. For competition–signal reduction assays, competitors (non-tagged MED15A-KIX or non-biotinylated NIMIN1-αH peptide) were mixed with NPR1 for 1 h followed before incubations with other components. For the assays with the NPR1–MED15A-KIX pair, 111.1 nM His–MBP–NPR1 and 12.3 nM biotinylated MED15A-KIX were used in each 50-μl reaction, and for the other pair, 5 nM His–MBP–NPR1 and 30 nM biotinylated NIMIN1-αH peptide were used in each 40-μl reactions. For SA–benzoic acid titration assays, up to 270 µM SA or benzoic acid was titrated into 111.1 nM His–MBP–NPR1 and 12.3 nM biotinylated MED15A-KIX. The experiments were performed in three replicates. IC50 was determined using non-linear curve fitting of the dose–response curves generated with Prism (GraphPad).
ITC
The effect of SA on the NPR1–MED15A-KIX interaction was examined using ITC. Measurements were conducted at 25 °C on a Malvern MICROCAL PEAQ-ITC instrument with the Malvern MICROCAL PEAQ-ITC Control software (v1.41). SA was loaded into the syringe and delivered into the sample cell via an initial 0.4-µl injection (0.8 s), followed by 18 2-µl injections (4 s each) with 150-s intervals and stirring at 750 rpm. To determine the NPR1–SA-binding affinity, 125 µM SA was titrated into 250 µl of 10 µM His–MBP–NPR1 (amino acids 40–564) purified from E. coli. To measure the cooperative binding of SA and MED15A-KIX, 100 µM SA was titrated into 250 µl of a mixture containing 27 µM His–MBP–NPR1 and 53.6 µM His–MBP–MED15A-KIX. A baseline heat response was obtained by titrating 100 µM SA into 250 µl of sizing buffer alone. Data were processed using the Malvern MICROCAL PEAQ-ITC analysis software (v1.41). Experimental thermograms were referenced against the buffer control to derive accurate dissociation constants.
Tritium-labelled SA membrane filter assay
Ring-3H SA (American Radiolabeled Chemicals, 20 µM in 20% ethanol, 1 mCi ml−1, 50 Ci mmol−1) was used to detect SA-specific binding to NPR1 in the absence and presence of MED15A-KIX in a vacuum filtration system. Specifically, 50 µl of 400 nM His–MBP–NPR1 purified from insect cell, 4 µM His–Venus–MED15A-KIX or the mixture of both proteins was incubated with equal volume of a mixture of cold (unlabelled) and hot (3H labelled) SA (8.6:1 cold:hot) at various concentrations in sizing buffer. Each reaction had three replicates. The samples were incubated in glass vials at room temperature for 30 min. Immediately before filtration, the 100-µl reactions in vials were diluted with 2.5 ml cold sizing buffer and quickly passed through 0.45-µm MCE membranes (MF-Millipore, 25 mm, hydrophilic) that were pre-soaked in sizing buffer overnight. The vials were further rinsed with 2.5 ml of cold sizing buffer twice. The membranes were subsequently transferred into clean scintillation vials and submerged in 5 ml of scintillation liquid (ULTIMA Gold, PerkinElmer). 3H radioactivity was read 2 min per sample with a scintillation counter (Beckman LS6500). For the NIMIN1 competition assay, each 100-µl reaction had 200 nM His–MBP–NPR1, 1.4 µM His–Venus–MED15A-KIX and 1 µM SA (8.6:1 cold:hot) and NIMIN1-αH peptide at various concentrations using the Tri-Carb 4910 TR Liquid Scintillation Analyzer (Revvity) with the same settings in the QuantaSmartTM for Tri-Carb (v5.3; Revvity).
Ratiometric BiFC
The 2in1 Plasmid Toolkit was a gift from C. Grefen (AddGene kit #1000000147). The constructs were made as previously described55. Specifically, coding sequences for NPR1, MED15A-KIX, MED15E-KIX, MED15D-FL and the full-length NIMIN1 were amplified from the constructs that were used for in vitro pulldown assays. The coding sequence for the Arabidopsis SKP1 (ASK1, AT1G75950), a negative control, was amplified from the A. thaliana cDNA library. NPR1 (with a stop codon) was designed to fuse to the C terminus of the N-terminal half of the YFP, and the others (without a stop codon) were fused to the N terminus of the C-terminal half. Primers consisted of the insert-specific sequence and the overlapping sequence with the entry vector pUC-L1L4 (for MED15s, NIMIN1 and ASK1 forward primers: 5′-ggctctagagtcgac-3′, reverse primers: 5′-gttgggtggccggcctgcag-3′) or pUC-L2L3 (for NPR1 forward primer: 5′-aagttgctagcgtcgac-3′, reverse primer: 5′-tgggtagccggcctgcag-3′). The entry vectors and inserts (except for ASK1) were linearized by double restriction digestion using SalI-HF and PstI (NEB) and gel extracted. To make the pUC-L1L4-ASK1 construct, pUC-L1L4 and ASK1 was linearized with restriction enzymes XbaI and PstI instead. The restriction-digested inserts and vectors were ligated using T4 DNA ligase (NEB) following the manufacturer’s instructions. The ligation mixture was used for transformation into E. coli (Stbl3)-competent cells. Colonies were picked, miniprepped (Qiagen) and confirmed with whole-plasmid sequencing (Genewiz, Azenta). The positive recombinant entry constructs were mixed the destination vector pBiFC-2in1-NC in a Gateway LR reaction to get the recombinant constructs. Expression of NPR1 fusions, MED15s–NIMIN1–ASK1 fusions and the red fluorescent protein (RFP) were all driven by independent 35S promoters. The resulting constructs were then transformed into Agrobacterium (GV3101) via electroporation. Colonies carrying the construct were validated with PCR for both NPR1 and the other inserts (MED15s, NIMIN1 and ASK1). Agrobacterium culture, activation and infiltration was carried out according to a previously published procedure56 with the following modifications. Agrobaterium at OD600 of 0.5 was activated in AS medium (150 µM acetosyringone, 10 mM MES-KOH pH 5.6 and 10 mM MgCl2) at room temperature for 3 h. Tobacco (Nicotiana benthamiana) plants were grown in growing mix soil (sungro) at 25 °C with a 16-h photoperiod with 100–150 μmol m−2 s−1 light intensity. The second and the third true leaves of six healthy 4-week-old tobacco plants were infiltrated with Agrobacterium carrying the appropriate constructs. After 48 h post-infiltration, the leaves of three individual plants were infiltrated again either with 10 mM MgCl2 (‘water’ or ‘mock’) or with 10 mM MgCl2 and 0.5 mM SA. Four leaf discs were collected for imaging with a hole puncher 5 h after the treatments. For NIMIN1 competition BiFC experiments, NIMIN1-FL was amplified with forward primer containing 5′-ggggacaagtttgtacaaaaaagcaggcttc-3′ and reverse primer containing 5′-ggggaccactttgtacaagaaagctgggtc-3′, besides the NIMIN1-specific sequences. NIMIN1 was cloned into the pDONR-Zeo entry vector and then the pEARLEYGate202 destination vector using Gateway Cloning. Agrobacterium carrying pBiFC-2in1-NPR1 + MED15A-KIX or pBiFC-2in1-NPR1 + NIMIN1 was mixed with the cells carrying pEARLEYGate202-NIMIN1 at a 1:1 ratio to OD600 of 0.5 for infiltration.
Confocal laser scanning microscopy and data analysis
All imaging was performed on a Nikon Ti2 Eclipse-CSU-X1 confocal spinning disc microscope equipped with four laser lines, 405, 488, 561 and 670 nm, and the Nikon Elements software NIS-Elements AR5.20.01. To detect YFP and RFP, the 488-nm and 561-nm lasers were used at 15% laser power, 100 mW across all samples. An Andor Zyla4.2 Plus sCMOS camera was used for image acquisition with a Nikon ×40/1.30 oil objective and with 100-ms exposure and 0.5-µm z-step set in the Nikon Elements software. All image analyses were done using the open access Fiji ImageJ software (v2.16.0/1.54p). As YFP was exclusively detected in the nuclei of tobacco epidermal cells, to measure the florescence intensity, a 11.663-µm2 region of interest (ROI) was applied in all the nuclei assessed. For each treatment, the YFP and RFP signal, and the background signal in each channel, from over 40 nuclei was measured. The YFP:RFP ratio was calculated as (YFPnucleusROI − YFPbackgroundROI)/(RFPnucleusROI − RFPbackgroundROI). The effects of SA treatment on NPR1–MED15A-KIX, NPR1–MED15A-KIX(E90K) and NPR1–NIMIN1 were analysed using two-tailed Welch’s t-test in Prism 10 (v10.6.1, GraphPad).
Semi-in vitro precipitation assay
A. thaliana (Col-0) plants were grown in growing mix soil (Sungro) at 25 °C with a 16-h photoperiod with 100–150 μmol m−2 s−1 light intensity. To induce the endogenous NPR1 level, 3-week-old Arabidopsis plants were sprayed with 1 mM SA with 0.1% (v/v) Silwet L-77 (Fisher Scientific) as the surfactant 24 h before use. Approximately 8 g of SA-treated leaves were harvested and ground in liquid nitrogen with a pestle and a mortar into 30 ml of extraction buffer (150 mM KCl, 50 mM HEPES pH 7.5, 10 mM EDTA, 0.5 mM Triton X-100, 20 mM dithiothreitol, 7 µM MG132, 1 mM PMSF and protease inhibitor cocktail). The crude extract was briefly sonicated with 20% amplitude, 0.5 s ON–0.5 s OFF for 2 min in iced water followed with centrifugation at 39,375g for 30 min at 4 °C. The lysate was then filtered into a new tube with a 0.45-µm filter (Fisher Brand). The baits, His–MBP-tagged MED15A-KIX, MED15A-B-KIX and MED15A-C-KIX, were purified from E. coli as described above. Proteins were adjusted to 1 mg ml−1 before use. EDTA-compatible nickel resin (Pierce High-Capacity EDTA-Compatible Ni-IMAC Resin) was equilibrated with sizing buffer and then incubated with saturating amount of each of three proteins on a rotator for 1 h at 4 °C. The supernatant was removed by centrifugation at 600g for 1 min. His–MBP–MED15-bound resin was then washed 3 times with 10 bed volumes of sizing buffer. To pull down the endogenous NPR1, 50 µl of resin was mixed with 1.5 ml of lysate containing 10 mM imidazole with or without 200 µl SA and incubated at 4 °C on a rotator overnight. The next day, the resin was invert incubated and washed with 1.5 ml of sizing buffer three times, each for 5 min before being boil-eluted (100 °C for 10 min) into 100 µl of 1× Laemmli buffer with 50 mM dithiothreitol. To assess the inputs, 3 µl of the elution was loaded on an SDS–PAGE gel, stained with Coomassie blue (40% ethanol, 0.1% Brilliant Blue R250 and 25% acetic acid) and destained for imaging. To detect endogenous NPR1, 20 µl of the elution was loaded on 4–15% Mini-Protean TGX gel (Bio-Rad). The gel was run with 1× Tris-glycine SDS running buffer at 150 V for 45 min and subsequently transferred to 0.2-µm PVDF membrane (Bio-Rad Trans-Blot Turbo, mini) with Trans-Blot Turbo (Bio-Rad) using the mixed molecular weight protocol (1.3 A at 250 V for 7.5 min). The membrane was washed with 1× TBS-T for 10 min twice before being blocked in the blocking solution (1× TBS-T and 5% milk) for 1 h at room temperature. The blocked membrane was washed with 1% milk in 1× TBS-T for 10 min twice before being incubated with the primary NPR1 antibody (gift from Z. Mou; rabbit, 1:5,000 dilution) on a shaker at 4 °C overnight. The next day, the membrane was washed with 1% milk in 1× TBS-T three times for 15 min and incubated with the secondary antibody (1:10,000 dilution; ECL horseradish peroxidase-conjugated anti-rabbit IgG, whole antibody from Cytiva) in 1× TBS-T and 1% milk at room temperature for 1 h. The membrane was washed again as above, and washed once with 1× TBS-T for 10 min. Freshly prepared SuperSignal West Femto Maximum Sensitivity Substrate (Protein Biology) was applied to the membrane. The signal was imaged with Chemiluminescent Blot, whereas the protein ladder was imaged with DyLight 680 Blot using the ChemiDoc MP imaging system (Bio-Rad).
Electrophoretic mobility shift assay
The electrophoresis mobility shift assay assay was carried out following a previously reported protocol13 with the following modifications. One strand of the LS5 and LS7 as-1 cis-elements of the SA-responsive PR1 gene promoter as-1 (LS5/LS7) was labelled with IRD-700 at the 5′ end (IRD700-5′- gggCTATGACGTAAGTAAAATAGTGACGTAGAGAggg-3′), whereas the other stranded remained unlabelled (5′-cccTCTCTACGTCACTATTTTACTTACGTCATAGccc-3′). The two oligos were dissolved in 1× TE buffer (10 mM Tris-HCl pH 8 and 1 mM EDTA) to make 100 µM stocks, which were mixed at a 1.25:1 ratio (labelled:unlabelled) with a slight excess of labelled strand as an endogenous loading control, and diluted with STE buffer (100 mM NaCl, 10 mM Tris-HCl pH 8.0 and 1 mM EDTA) to get 2 µM double-stranded DNA stock by annealing in boiled water that gradually cooled down to room temperature. The annealed stock was stored at −20 °C in dark until use. The 4–12% TBE gel (Invitrogen) was pre-run in 0.5× TBE buffer (44.5 mM Tris-HCl, 44.5 mM borate and 1 mM EDTA pH 8.3) at 100 V for 30 min. To determine the minimal amount of DNA to use in the assays, the annealed DNA was loaded on the gel at various concentrations (from 847 pM to 50 nM). A follow-up electrophoresis mobility shift assay, where TGA3 (amino acids 87–384) was titrated into 600 pM DNA, was carried out to determine the optimal TGA3 concentration. Two more assays were carried out to determine the optimal concentrations of NPR1 and MED15, respectively. Each component was diluted in the reaction buffer (150 mM NaCl, 20 mM HEPES pH 7.5, 0.5 mM TCEP, 1 mM dithiothreitol and 0.5% Tween-20) to make the working stocks. In the final assay, each 9-µl reaction contained 100 ng µl−1 poly(dI-dC) (Thermo Fisher) and 600 pM DNA. His–MBP–TGA3 (amino acids 87–384; 50 nM), His–MBP–NPR1 or His–MBP–NPR4 (15 µM), His–MBP–MED15A-KIX (23.4 µM) and SA (200 µM) were added sequentially across reactions. The reactions were incubated on ice for 30 min, and before loading, 1 µl of 10× orange loading dye (65% sucrose, 10 mM Tris-HCl pH 7.5, 10 mM EDTA and 0.3% (w/v) orange G) was added. The gel was run at 100 V for 100 min at 4 °C and detected using Image Studio (v5.2) (LICORbio) and the LI-COR Odyssey CLx scanner.
Cryo-EM sample preparation and data collection
His–MBP–MED15A-KIX was co-expressed with His–Venus–NPR1 in E. coli (BL21) in LB supplemented with 200 µM SA. The complex was purified with amylose resin. The tags were removed by incubating the protein complex with TEV at 10:1 molar ratio overnight. The TEV-treated sample was then concentrated for size exclusion with Superdex 200 increase (Cytiva) in sizing buffer to separate out the tags and TEV from the complex. The purified NPR1–MED15A-KIX complex at 2 mg ml−1 was then crosslinked with 2 mM BS3 (Thermo Fisher Scientific) at room temperature for 30 min. The crosslinking reaction was quenched with 50 mM Tris-HCl pH 7.5. To get rid of the crosslinker, the crosslinked sample was purified again with size exclusion. SA at 200 µM was included in all purification steps. The crosslinked NPR1–MED15A-KIX complex was then concentrated to a concentration between 2 and 3.5 mg ml−1. Immediately before grid preparation, 9 µl of the complex was mixed with 1 µl of 10× DM (1%; detergent E from the VitroEase Buffer Screening Kit, Thermo Fisher Scientific). Glow-discharged amorphous Ni-titanium (ANT) holey foil grids (gold support, 300 mesh, 1.2/1.3 aperture Pitch; Molecular Dimernsions, Calibre Scientific) were used. Three microlitres of the sample was manually applied on the ANT grid for 20 s before manfully blotted at room temperature. Manual application and blotting were repeated one more time. The grid was then loaded into the 10 °C, 100% humidity Vitrobot (Vitrobot Mark IV System, Thermo Fisher Scientific), where another 3 µl of sample was applied and two-sided blotted with two layers of blot paper with blot force 0 for 9 s in the Vitrobot chamber. The grid was plunged into liquid ethane and stored in liquid nitrogen for clipping. The clipped grid was screened with Talos Glacios (Thermo Fisher Scientific) equipped with a K3 camera. Data collection was carried out on a Titan Krios transmission electron microscope (Thermo Fisher Scientific) operated at 300 kV at the University of Washington as previously described54. The automation scheme was implemented using the SerialEM software (v4.1)57 at a nominal magnification of 105,000, resulting in a physical pixel size of 0.829 Å; a total dose of 60 e− Å−2 for each image fractionated into 100 frames. The images were recorded at a defocus range of 1–2 μm.
Cryo-EM image processing and three-dimensional reconstruction
A total of 21,687 movies were acquired from two grids and processed in CryoSparc (v4.4.1)58. Beam-induced motion of each micrograph stack was corrected by patch motion correction. The defocus parameter of each motion-corrected micrograph was determined by contrast transfer function estimation. After filtered with contrast transfer function parameters and visual inspection, 15,862 micrographs were kept for subsequent processing. A total of 7,233,717 particles were blob picked, extracted and subjected to two rounds of two-dimensional classification. A subset of the selected particles in decent two-dimensional classes were used for ab initio reconstruction and heterogenous refinement. Particles from the good reconstruction were cleaned up again with three more rounds of heterogenous refinement with a good heterogenous refinement volume from a previous data collection included. A total of 773,558 particles were kept, re-extracted without Fourier crop to box size and subjected to non-uniform refinement59 to generate a reconstruction with an overall resolution of 3.22 Å.
Cryo-EM structural model building and refinement
The initial structural model of dimeric NPR1–MED15A-KIX was predicted with AlphaFold3 at the AlphaFold Server60, and that of the dimeric NPR1–MED15A-KIX in complex with SA was predicted with Protenix61. The predicted models were fitted into the 3.22 Å cryo-EM density map using UCSF ChimeraX (v1.9)62. Subsequently, the model was inspected and manually refined in Coot (v0.9.8.95; ccp4) based on the protein sequences and the electron microscopy density. The model was further improved by real-space refinement in PHENIX (v1.21.2-5419) and manual rebuilding in Coot63,64,65. The final model was obtained from refinement using Rosetta66,67 and then real-space refinement in PHENIX again. PyMOL (v2.6.2; The PyMOL Molecular Graphics System, Schrödinger) was used to generate figures.
Crystallization, data collection and structural determination
Crystals of the mMBP–A5–NPR1-SBDΔ4–NIMIN1-αH complex were grown at 4 °C by the hanging drop vapour diffusion method using 0.225 µl protein sample, supplemented by 10 mM maltose, mixed with 0.075 µl reservoir solution (0.2 M ammonium chloride, 0.1 M Na-HEPES pH 7.5 and 25% w/v PEG 3350). The largest crystal was harvested and flash-frozen in the crystallization condition with 27% sucrose at −170 °C. The X-ray diffraction dataset was collected at a wavelength of 1 Å at the BL2.0.1 beamline at the Advanced Light Source in Berkeley and was integrated and scaled by the XDS package68. The complex structure was solved by molecular replacement using PHENIX with a structural model predicted by AlphaFold3. The complex structure model was rebuilt, refined and ligand fitted using Coot63 and PHENIX64,65 (final Ramachandran statistics: 97.81% favoured, 1.71% allowed and 0.48% outliers). PyMOL (The PyMOL Molecular Graphics System, v2.0, Schrödinger) was used to generate figures.
HDX-MS
Stock concentrations of NPR1 (3.4 µM) were pre-incubated either alone or in a complex with either a 300-fold excess of SA or a 300-fold excess of SA and 3-fold excess of MED15A-KIX for 4 h. Each stock was diluted into 90 µl of deuterated buffer (150 mM NaCl, 20 mM HEPES pH 7.5, 0.5 mM TCEP and 85% D final) containing 0.2 nM bradykinin and incubated for 3 s, 1 min, 20 min or 2 h at 21 °C. Each starting stock also included a mixture of imidazolium compounds to serve as exchange reference standards69. At the desired time point, the sample was rapidly mixed with an equal volume of ice-cold 200 mM TCEP, 0.2% formic acid and 0.1% trifluoroacetic acid for a final pH of 2.5. Samples were then immediately frozen on ethanol/dry ice and stored at −80 °C until liquid chromatography–mass spectrometry analysis. Undeuterated samples were prepared the same way but with undeuterated buffer for each step.
Samples were thawed at 5 °C for 8 min and injected using a custom LEAP robot integrated with a liquid chromatography–mass spectrometry system70. The protein was first passed over a Pepsin column (2.1 × 30 mm; AffiPro) at 400 µl min−1 for inline digestion with the protease column held at 20 °C. Peptides were then trapped on a Waters XSelect CSH C18 trap cartridge column (2.1 × 5 mm, 2.5 µm) and resolved over a CSH C18 column (1 × 50 mm, 1.7 µm, 130 Å) using linear gradient of 5–35% B (A: 0.1% formic acid, 0.025% trifluoroacetic acid and 5% acetonitrile; B: acetonitrile with 0.1% formic acid) over 10 min and analysed on a Thermo Orbitrap Ascend mass spectrometer at a resolution setting of 120,000. A series of washes over the trap and pepsin columns was used between injections to minimize carry-over as previously described70. Data-dependent tandem mass spectrometry acquisition was performed on an undeuterated sample using rapid collision-induced dissociation and higher-energy collisional dissociation scans and processed in Byonic (Protein Metrics) with a score cut-off of 150 to identify peptides. Deuterium incorporation was analysed using HDExaminer (v3; Trajan Scientific and Medical). Spectra displaying bimodal behaviour were exported from HDExaminer and analysed in HX-Express (v3)71.
Reporting summary
Further information on research design is available in the Nature Portfolio Reporting Summary linked to this article.
Keep following us for the latest insights.