RNA sequencing and analysis E. coli BL21(DE3) cells (NEB: C2527H), which lack endogenous copies of IS621 elements, were transformed with plasmids encoding either the RE–LE junction or the LE–recombinase–RE region of the IS621 element. The cells were plated on LB (lysogeny broth) agar with kanamycin and grown overnight at 37 °C. Colonies were scraped from the
RNA sequencing and analysis
E. coli BL21(DE3) cells (NEB: C2527H), which lack endogenous copies of IS621 elements, were transformed with plasmids encoding either the RE–LE junction or the LE–recombinase–RE region of the IS621 element. The cells were plated on LB (lysogeny broth) agar with kanamycin and grown overnight at 37 °C. Colonies were scraped from the plates, and RNA was extracted using a Direct-zol RNA miniprep kit (Zymo Research). To assess the expression of the IS621 elements encoded in the E. coli genome, RNA was extracted using a Direct-zol RNA miniprep kit from One Shot E. coli Mach1 T1R cells (F– φ80lacZΔM15 ΔlacX74 hsdR(rK–, mK+) ΔrecA1398 endA1 tonA) (Thermo Fisher Scientific, C862003) harvested from bacterial plates 24 h after plating at 37 °C.
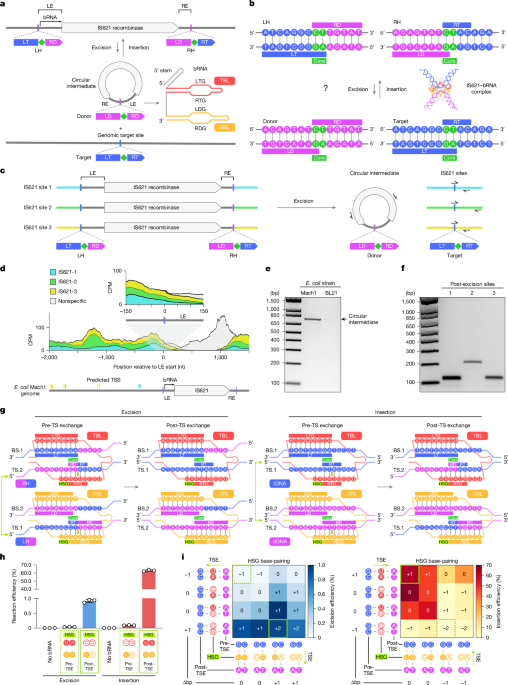
RNA-seq was carried out on a NovaSeq X Plus sequencer in collaboration with Novogene Research Services (Novogene). Paired-end RNA-seq reads from each sample were aligned to the respective plasmid and genomic reference sequences using Burrows–Wheeler Aligner-MEM17. Aligned reads were filtered using SAMTools18 for reads that originated from the strand that encodes the bRNAs. For each locus of interest on the reference sequences, we used the Pysam Python module to count the coverage depth at the single-base level from these filtered reads, with a quality threshold of 0. As the E. coli Mach1 genome has three separate IS621 loci that are highly homologous with one another, many of the RNA-seq reads that mapped to these regions were expected to lack unique mapping to one of the three loci. Thus, among the reads that were mapped to any of the IS621 loci, pairs of reads in which either pair had a mapping quality of zero (meaning the read can map equally well to other parts of the reference sequence) were classified as ‘nonspecific’ reads, and the coverage from these reads was counted separately from the reads that mapped specifically to one of the three IS621 loci.
Detection of plasmid-based IS621 excision by PCR
Plasmids containing elements with the wild-type bRNA (pre-TSE for excision) or the engineered bRNA (post-TSE for excision) were transformed into E. coli BL21(DE3), which lacks endogenous copies of IS621 elements, ensuring that all detected excision events originate from the plasmid-borne construct. For constructs lacking a T7 promoter upstream of the bRNA, bacteria were plated on LB agar with kanamycin and grown overnight at 37 °C. For constructs with a T7 promoter, plates were supplemented with 0.07 mM IPTG. Colonies were scraped from plates, and plasmid DNA was extracted using a QIAprep Spin Miniprep Plus Kit (Qiagen). Primers were designed to span the post-excision (LT–RT) junction site left after element excision from the plasmid and yield a 110-bp product. The same primers used to detect circularized IS621 intermediates from the Mach1 genome were also used to confirm the production of circular intermediates from plasmid-borne constructs, yielding a 725-bp product. All PCRs were performed with the same protocol described below for the detection of native IS621 excision and were fractionated on 2% agarose gels and visualized with SYBR Gold (Thermo Fisher Scientific). All PCR products were sequence-verified by Sanger sequencing.
Detection of circular intermediates and post-excision sites
Genomic DNA was isolated from freshly purchased aliquots of E. coli strains in liquid culture using Zymo Quick DNA Miniprep Plus Kits (Zymo), according to the instructions of the manufacturer. Whole-genome sequencing was performed at 100× coverage using the Plasmidsaurus whole-genome nanopore sequencing service, which confirmed that the One Shot Mach1 E. coli T1R strain harbours three copies of IS621, whereas the E. coli BL21(DE3) strain contains zero copies. Bacteria were plated on LB agar and grown overnight at 37 °C. Colonies were then scraped from the plates, and total DNA was extracted using a Zymo Quick DNA Miniprep Plus Kit. Primers were designed to match all three IS621 recombinase-coding sequences in the Mach1 genome, such that PCR amplification would occur only on excised and circularized IS621 sequences from any locus. Moreover, primers were designed to base pair with the junction remaining post-excision at all three loci encoding IS621, such that amplification with a downstream primer would yield a specific product. All PCRs were performed using Platinum SuperFi 2× MasterMix (Thermo Fisher Scientific) with the following protocol: 98 °C for 120 s; 25 cycles of 98 °C for 10 s, 65 °C for 15 s and 72 °C for 15 s; and 72 °C for 2 min. PCR products were subsequently fractionated on 2% agarose gels and visualized with SYBR Gold.
In vitro recombination measurement by qPCR
DNA substrates (51-bp LH, 121-bp RH, 86-bp tDNA and 86-bp dDNA) were purchased from IDT as ssDNA and annealed by heating to 95 °C followed by slow cooling to 4 °C over 1 h in a thermocycler. DNA substrates (0.25–0.5 µM) were mixed with the IS621–bRNA complex (10 µM) in 20 µl buffer containing 20 mM Tris-HCl, pH 7.5, 300 mM NaCl, 5 mM MgCl2 and 1 mM dithiothreitol (DTT), and then the reactions were incubated at 37 °C for 2 h. The reactions were quenched by the addition of 50 mM EDTA, treated with 8 µg RNase A (NEB) at 50 °C for 1 h, and then treated with 3 units of Proteinase K at 37 °C for 1 h. After RNA and protein digestion, the DNA was purified using DNA Clean & Concentrator-5 (Zymo Research) and eluted with 75 °C nuclease-free water. For qPCR analysis, reaction dilutions were prepared, and qPCR was performed on a LightCycler 480 II instrument (Roche) using primers and PrimeTime qPCR probes (final concentration 0.5 µM) purchased from IDT, along with TaqMan Fast Advanced qPCR mix. In vitro recombination products are expected to have an unligated bottom strand, with the two nucleotides adjacent (3′) to the core mismatched with the top strand, after the bottom strand exchange step of the reaction mechanism. Therefore, to accurately quantify the reaction efficiency, considering the polymerase processivity through lesions and the primer binding near nicks, qPCR signals for different reactions were compared with standard curves generated using known quantities of 121-bp RH (LD–RT, insertion product) DNA and 86-bp target (LT–RT, excision product) DNA containing an unligated bottom strand with the expected mismatches adjacent to the core. These standards were prepared by annealing the top strand of RH/target (121/86 nt) with two oligos (56- and 65-nt RH and 56- and 30-nt target) constituting the bottom strand.
In vivo excision efficiency measurement by qPCR
To determine the excision efficiency in E. coli using the wild-type (pre-TSE for excision) and the engineered bRNA (post-TSE for excision) encoded within the LE of the IS621 element, 100 ng of sequence-verified plasmid, confirmed by nanopore sequencing to lack pre-excised molecules in the input population, was transformed into chemically competent BL21(DE3) cells, which were recovered in SOC (super optimal broth) medium for 1 h at 37 °C, plated onto kanamycin-selective agar and grown overnight at 37 °C. All colonies from a single transformation plate were bulk-harvested by scraping into liquid medium, providing a population-level average of excision efficiency across thousands of independent clonal lineages and minimizing bias from stochastic colony-to-colony variation. Total plasmid DNA was extracted from each pooled sample using a QIAprep Spin Miniprep Plus Kit (Qiagen), and qPCR was carried out on 400 ng of the extracted plasmid. Primers and probes were designed to amplify the KanR resistance marker (HEX) as a measure of total plasmid, as well as the post-excision junction (LT–RT, FAM) on plasmids that had undergone excision of the IS621 element. Multiplexed TaqMan qPCR was performed on a control plasmid containing both the post-excision junction and the KanR marker to determine the relative amplification efficiencies of the two probes. This inter-channel correction factor was applied when calculating the excision efficiency from experimental samples. At least three independent transformations were performed to confirm the reproducibility of the population-level measurement.
Protein and RNA preparation
The IS621 recombinase protein was prepared as described previously2. Briefly, the IS621 gene was cloned into a modified pFastBac1 vector encoding an N-terminal His6–Twin-Strep tag and an HRV3C cleavage site. Sf9 cells were infected with the baculovirus and cultured at 27 °C for 48 h. The cells were harvested and lysed, and the soluble fraction was purified by Strep-Tactin affinity chromatography followed by size-exclusion chromatography. The purified protein was concentrated and stored at −80 °C, in buffer containing 20 mM HEPES-NaOH, pH 7.5, 500 mM NaCl, 2 mM MgCl2, 1 mM DTT and 10% glycerol, until use. The bRNAs were transcribed in vitro with T7 RNA polymerase and purified by 10% denaturing (7 M urea) polyacrylamide gel electrophoresis (Supplementary Table 1).
In vitro recombination assays with fluorescently labelled DNA substrates
DNA substrates (38-bp LH, 44-bp RH, 38-bp tDNA and 44-bp dDNA) were purchased from Eurofins Genomics. The LH and tDNA were labelled with Cy5 at the 5′ ends of the top strand (Supplementary Table 1). The DNA substrates (0.4 µM; LH and RH for excision or tDNA and dDNA for insertion) were mixed with the pre-incubated IS621–bRNA complex (2 μM) in 10 µl buffer containing 20 mM Tris-HCl, pH 7.5, 300 mM NaCl, 5 mM MgCl2 and 1 mM DTT, and then the reactions were incubated at 37 °C for 1 h. The reaction mixture was mixed with Proteinase K (Nacalai Tesque) and incubated at 95 °C for 2 min in denaturing buffer (7 M urea). The samples were analysed on an 18% TBE–urea denaturing gel, and fluorescent signals were imaged using FUSION Solo S (Vilber Bio Imaging).
Excision complex preparation
The excision complex was reconstituted by mixing the purified IS621 recombinase, a 177-nt bRNA (177 nucleotides plus a 5′ GGG leader for in vitro transcription) and DNA substrates (LH and RH) containing 4-nt mismatches on the top strands. The bRNAs with pre-TSE and post-TSE were used for reconstitution of the excision complex in the pre- and post-strand exchange states, respectively. The reconstituted complex was purified by size-exclusion chromatography on a Superose 6 Increase 10/300 column (Cytiva), equilibrated with buffer (20 mM Tris-HCl, pH 7.5, 300 mM NaCl, 5 mM MgCl2 and 1 mM DTT). The purified excision complex was concentrated to 0.5–1 mg ml−1 using an Amicon Ultra-4 centrifugal filter unit (MWCO 50 kDa; Millipore). Protein concentrations were determined using the Pierce 660 nm Protein Assay Reagent.
Cryo-EM analysis
For cryo-EM data collection, Quantifoil Holey Carbon Grids (R1.2/1.3, Au, 300 mesh) (SPT Labtech) were glow-discharged in low-pressure air at a 10 mA current in a PIB-10 (Vacuum Device). The excision complex solution was applied to freshly glow-discharged grids using a Vitrobot Mark IV system (Thermo Fisher Scientific) at 4 °C, with a waiting time of 10 s and a blotting time of 6 s under 100% humidity conditions. The grids were plunge-frozen in liquid ethane cooled by liquid nitrogen.
The grids were transferred to a Titan Krios G3i TEM (Thermo Fisher Scientific), running at 300 kV and equipped with a Gatan Quantum-LS Energy Filter (GIF) and a Gatan K3 Summit direct electron detector. Imaging was performed at a nominal magnification of 105,000×, corresponding to a calibrated pixel size of 0.83 Å per pixel (px). Each movie was dose-fractionated to 50 frames at a dose rate of 7.8 e− px−1 s−1 at the detector in the correlated double sampling mode, resulting in a total accumulated exposure of 50 e− Å−2 of the specimen. The data were automatically acquired using the image-shift method in the EPU software (Thermo Fisher Scientific), with a defocus range of −0.8 μm to −2.0 μm.
The data were processed using the cryoSPARC v.4.4.0 software package19. The dose-fractionated movies were aligned using Patch Motion Correction, and the contrast transfer function (CTF) parameters were estimated using patch-based CTF estimation. For the excision complex with the pre-TSE bRNA, particles were automatically picked using Blob Picker and Template Picker, followed by reference-free two-dimensional classification to curate particle sets. The particles were further curated by several cycles of Heterogeneous Refinement. The best class particle set was refined using Homogeneous Refinement, yielding a map at 2.71-Å resolution. Reference-Based Motion Correction followed by Non-Uniform Refinement with optimization of the CTF value yielded a map at 2.44 Å resolution (according to the Fourier shell correlation (FSC) = 0.143 criterion)20 using a tight mask; however, the final reported resolution was determined to be 2.53 Å based on the FSC calculated using the softer refinement mask. For the excision complex with the post-TSE bRNA, particles were automatically picked using Template Picker followed by reference-free two-dimensional classification. The particles were further curated by several cycles of Heterogeneous Refinement. The best class particle set was refined using Non-Uniform Refinement, yielding a map at 2.62 Å resolution. Reference-Based Motion Correction followed by Non-Uniform Refinement with optimization of the CTF value yielded a map at 2.41 Å resolution (according to the FSC = 0.143 criterion) using a tight mask; however, the final reported resolution was determined to be 2.55 Å based on the FSC calculated using the softer refinement mask. The local resolution was estimated by BlocRes in cryoSPARC.
Model building and validation
The models of the excision complexes were manually built with COOT21, using the IS621 insertion complex model (PDB ID: 8WT6) as the initial model, and then refined using Servalcat22 against unsharpened half-maps. The models were validated using MolProbity23. The statistics of the three-dimensional reconstruction and model refinement are summarized in Extended Data Table 1. The cryo-EM density maps were calculated with UCSF ChimeraX24, and molecular graphics figures were prepared with CueMol (http://www.cuemol.org).
Microscale thermophoresis
Microscale thermophoresis (MST) was performed using a Monolith NT.115 Pico Series instrument (NanoTemper Technologies) with premium capillaries. The IS621 recombinase was labelled using a RED-MALEIMIDE 2nd Generation cysteine-reactive kit (NanoTemper Technologies), according to the instructions of the manufacturer. The labelled protein was diluted in buffer containing 20 mM Tris-HCl, pH 7.5, 500 mM NaCl, 5 mM MgCl2, 1 mM DTT and 0.01% Tween 20, and ligands were prepared by dilution in the same buffer. For ligand preparation, DNA was purchased from IDT and annealed in buffer containing 10 mM Tris, pH 8.0, 5 mM MgCl2 and 5 mM KCl. To determine the affinities of the IS621–RNA complex for the DNA substrates (tDNA, dDNA, LH and RH), the IS621–RNA complex (20 nM) was incubated with serial dilutions (0.3 nM to 10 µM) of each relevant DNA ligand. MST measurements were performed at 37 °C with 8% LED excitation and medium MST power in the Pico-RED excitation mode. Data were analysed using the NanoTemper MO.affinity analysis software package, and raw data were plotted on Prism for visualization.
Reporting summary
Further information on research design is available in the Nature Portfolio Reporting Summary linked to this article.
Keep following us for the latest insights.