Protein extraction Proteins were extracted from bone powder of Xujiayao hominin samples and animal samples from the same layer (Supplementary Tables 1 and 9) using previously published methods61,62. All sample preparations were performed using personal protective equipment in the dedicated clean room for ancient protein analysis in the Molecular Paleontology Laboratory, Institute of Vertebrate Paleontology
Protein extraction
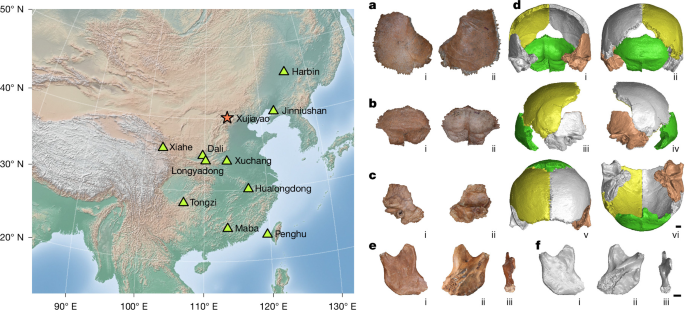
Proteins were extracted from bone powder of Xujiayao hominin samples and animal samples from the same layer (Supplementary Tables 1 and 9) using previously published methods61,62. All sample preparations were performed using personal protective equipment in the dedicated clean room for ancient protein analysis in the Molecular Paleontology Laboratory, Institute of Vertebrate Paleontology and Paleoanthropology, Chinese Academy of Sciences. For the hominin samples, a minimal-impact sampling was conducted, which did not adversely affect macroscopic morphology analysis. A small hole in each sample was drilled to collect the bone powder, while protecting surrounding areas with aluminium foil during the drilling procedures (Supplementary Fig. 12). The holes were kept as small as possible to avoid affecting important morphological features. The 3D scan was done before protein extraction to preserve the complete morphological structure.
Samples of drilled hominin bone powder were demineralized in 0.6 M HCl and then separated. After centrifugation, the supernatant was ultrafiltered through an Amicon Ultra-4 (3 kDa) centrifugal filter unit. After washing the filtration units with 50 mM ammonium bicarbonate solution (ABC), the filtered proteins were dissolved in ABC and referred to as the acid-soluble fraction (3 kDa). The acid-insoluble pellet was washed with ultrapure water until neutral and then incubated with 50 mM ABC at 65 °C for 3 h. After centrifugation, the supernatant was collected as acid-insoluble fraction 1 (pellet). The new acid-insoluble pellet was rinsed in the same way as the first pellet, and then incubated with 50 mM ABC at 65°C for 3 h. The supernatant with pellet was regarded as acid-insoluble fraction 2 (pellet 2). For the hominin samples, three fractions were collected for further digestion and mass spectrometry analysis, and, for the animal samples, only the conventional acid-insoluble fraction 1 (pellet) fraction was used.
All of these fractions were digested with 3 μl of 0.4 μg μl−1 porcine trypsin (Promega) overnight at 37 °C, then stopped by adding trifluoroacetic acid to a final concentration of 0.1%. Peptides were desalted and eluted using Pierce C18 Pipette Tips (Thermo Fisher Scientific). A small aliquot of the elution was used for MALDI-TOF analysis. The other elution of the hominin samples was dried for the LC–MS/MS analysis. For PA1490, neither the ‘pellet’ nor the ‘pellet 2’ elution showed an obvious collagen signal, so they were combined for further LC–MS/MS analysis. Extraction blanks following the identical procedure were used to estimate protein contamination during protein extraction and analysis. A bone sample from a modern camel (Camelus bactrianus) was also extracted concurrently with the samples as a positive control.
For preliminary collagen assessment, the peptides were screened on MALDI-TOF MS after protein digestion and peptide purification. All samples were analysed in triplicate on the Bruker autoflex maX MALDI-TOF mass spectrometer. Specifically, 1 μl of sample was spotted onto an MTP384 Bruker ground-steel MALDI target plate, and 1 μl of α-cyano-4-hydroxycinnamic acid matrix solution (1% in 50% ACN/0.1% trifluoroacetic acid (v/v/v)) was added to and mixed with the sample. Mass spectra were obtained over 700–3,500 m/z, and the raw files were then processed using mMass (v.5.5.0)63. Peak picking parameters in mMass were S/N threshold=3.0, Abs. intensity threshold=0.0, Rel. intensity threshold=0.5%, and picking height=90(%). Baseline, smoothing and deisotoping were applied and no shoulder peaks were removed.
The LC–MS/MS experiments were performed in two independent laboratories. For the LC–MS/MS analysis at Capital Medical University (labelled as SY), the eluted peptides from the bone powder samples were analysed under DDA mode on an Orbitrap Fusion Lumos mass spectrometer (Thermo Fisher Scientific) coupled to an Easy nLC 1200 system (Thermo Fisher Scientific). The peptides were initially loaded onto a trap column (100 μm inner diameter × 2 cm, C18) and then separated on an analytical column (150 μm inner diameter × 15 cm). Both columns were packed in-house with reversed-phase silica of 3 μm (Reprosil-Pur C18 AQ, Dr. Maisch). The elution of peptides was carried out using a 120 min linear gradient, increasing from 2 to 100% solvent B (where solvent A is 0.1% formic acid in water, and solvent B is 0.1% formic acid in 80% acetonitrile) at a flow rate of 500 nl min−1. MS1 data were acquired across 375–1,400 m/z with a resolution of 120,000, a 250% AGC target and a maximum injection time of 50 ms. MS2 scans were performed at a resolution of 15,000 with an AGC target of 100%, a 35% normalized collision energy and a maximum injection time of 22 ms. Two runs were conducted to obtain more peptide identification from three fractions from PA1497 and the acid-soluble fraction from PA1490. Blank extractions were processed concurrently to monitor the exogenous contaminants during the procedure.
The LC–MS/MS analyses were processed on an Orbitrap Exploris 480 mass spectrometer with a FAIMS Pro device (Thermo Fisher Scientific) coupled to the Easy nLC 1200 system (Thermo Scientific) at Fudan University, Shanghai (labelled as FD). Then, 4.00 μl of sample solution was injected for each fraction, and the peptides in solution were separated on a home-packed analytical column (75 μm inner diameter × ~25 cm; 1.9 μm, ReproSil-Pur 120 C18-AQ, Dr. Maisch). The LC flow rate was 0.80 μl min−1 under a 500.00 Bar maximum pressure. Mobile phase A consisted of 0.1% formic acid, and mobile phase B consisted of 80% acetonitrile and 0.1% formic acid. A 80 min gradient was used with the following profile: 5–8% B, 2 min, at a flow rate of 200 nl min−1; 8–44% B, 38 min, 200 nl min−1; 44–70% B, 8 min, 200 nl min−1; 70–100% B, 2 min, 200 nl min−1; 100% B, 10 min, 200 nl min−1; 100–5% B, 2 min, 200 nl min−1; 5% B, 2 min, 300 nl min−1; 5–100% B, 6 min, 300 nl min−1; 100% B, 10 min, 300 nl min−1. Full MS scans were acquired for the first 65 min, across the range of m/z 350–1,600 with a resolution of 60,000 and an isolation window of 1.6 m/z. Standard AGC target and auto maximum injection time mode were set. The MS/MS spectra were acquired at a resolution of 15,000 with standard AGC target, a maximum injection time of 30 ms and a normalized collision energy of 30%. The column was then washed and re-equilibrated without data acquisition for 15 min.
Proteomic data analysis
To verify the taxonomic identification (Homo), the MS/MS data files from each LC–MS/MS run were searched against a custom Mammalia type I collagen database, comprising type I collagens of mammals on GenBank and UniProt. Next, raw files were searched against our previously published database8, which included the modern human proteome and common bone and dentine proteins translated from archaic hominin genomes (hereafter, the Harbin database). This search was conducted to obtain accurate sequences for the bone proteome of the Xujiayao hominin samples. A common contaminant database was also included in each database search, which comprised the cRAP database (https://www.thegpm.org/crap/), the contaminant database from MaxQuant64 and a published contaminant database65.
All PEAKS Online (v.12)66 searches, including de novo, DB Search, PTM and SPIDER, were conducted using a precursor ion (MS1) mass tolerance of 10 ppm and a fragment ion (MS2) mass tolerance of 0.02 Da. Semispecific trypsin cleavage was applied, allowing a maximum of two missed cleavages in the searches. We included deamidation (NQ), oxidation (M), hydroxylation (P), Pyro-Glu from E and Pyro-Glu from Q as variable modifications, with no fixed modifications, allowing up to six modifications per peptide. The length range of peptides was 8–45 amino acids. A 1% false-discovery rate (FDR) at the peptide level was set, and proteins were filtered using the criteria of −10log10[P] ≥ 20. Other parameters were the default.
To validate our analysis result, we also conducted a search with MaxQuant (v.2.6.0.0). Digestion and modification parameters were the same as those used in PEAKS. Proteins were filtered with 10% FDR level to identify potential low-abundance proteins8,11,67,68,69, and the PSM FDR was 1%. Other parameters were set to the default. For monitoring the contaminant proteins from the experiment and comparing with other published individuals, we also searched our extraction blank data and the published Xiahe 1 and Xiahe 2 data12,28 using the same strategy.
To assess the endogeneity of the identified proteins, overall Asn and Gln deamidation rates for each sample were first calculated on the basis of peptide intensities70. Then, peptides associated with multiple genes were excluded, and the Asn and Gln deamidation rates were calculated for each identified protein on the basis of PSM counts. Proteins containing one or fewer Gln/Asn-containing peptides were excluded. Proteins with low deamidation rates were considered exogenous, while those with relatively high deamidation rates (Asn or Gln) in both PEAKS and MaxQuant results were classified as endogenous ancient proteins (Supplementary Table 4). Additional attempts to find other proxies to classify and confirm endogenous proteins were in Supplementary Text 7, Supplementary Tables 10–16 and Supplementary Figs. 13–19. We did not use those additional proxies here as they were not well examined with enough data.
The number of peptides and PSMs covering phylogenetically informative sites, along with their y or b ion conditions, was evaluated to assess their reliability. After removing peptides which could match bacteria or fungi, or could be attributed to other proteins from plants or animals possibly distributed around Xujiayao site by BLASTp (https://ngdc.cncb.ac.cn/blast/blastp/), only the sites with at least two remaining peptides from both PEAKS and MaxQuant were retained. The y and b ions of each spectrum were then checked. The sites were considered reliable only if at least one related spectrum contained enough y and b ions. If the sites were located at the terminals of the peptides, at least 1 of the 2 possible y or b ions was required. If not, at least 2 of the 4 possible y or b ions was required. An additional test of Penghu-specific SAP COL5A2-E1211V was also conducted, but no reliable evidence supporting E or V was obtained (Supplementary Text 5 and Supplementary Fig. 20).
Construction of consensus protein sequences and phylogenetic analysis
For each endogenous protein, peptides with abnormal or artificial post-translational modifications were excluded. Only alleles that met the strict criteria of PSM count ≥ 2, PSM ratio ≥ 25% and intensity ratio ≥ 10% were considered reliable and were retained, regardless of whether known or novel. For sites with both H/D (an oxidation product of His), P/E (di-oxidation product of Pro), N/D (deamidation product of Asn), or Q/E (deamidation product of Gln) residues, we changed them to single fixed His, Pro, Asn or Gln, respectively, as the alternative amino acids were probably derived from common taphonomic post-translational modifications. We then converted all leucine to isoleucine as they are isobaric. Consensus sequences were subsequently filtered by multisoftware confirmation, and only the amino acid positions that had overlapping coverage in both PEAKS and MaxQuant results were retained. This strategy resulted in 9 proteins with consensus sequences out of the 18 endogenous proteins (Supplementary Data 1). COL4A4 was excluded from further phylogenetic analysis as it was identified only in PA1490 with very low coverage (13 amino acids, 0.77% of the total sequence). We selected two Xujiayao hominin samples, Denisova3 (ref. 29), Altai (Neanderthal)32 and Vindija33.19 (Neanderthal)31 in the Harbin database, and 50 randomly selected present-day human sequences from the Human Genome Diversity Project (HGDP)71 to build the comparative dataset. For genome data retaining heterozygous amino acids, we randomly chose one protein sequence per individual. P. troglodytes sequences translated from a published high-coverage genome (Clint)72 were used as the outgroup. We used PartitionFinder2 (v.2.1.1)73 to find the optimal partitioning schemes and amino acid substitution models. Subsequently, we constructed a consensus Bayesian phylogenetic tree using the software MrBayes (v.3.2.6)74, running for 10 million iterations in 2 independent runs, sampling every 500 generations, with the first 2 million iterations discarded as a burn-in. Additional phylogenetic trees based on different datasets were also conducted using the same procedure (Supplementary Text 4 and Supplementary Figs. 7 and 21–23).
Measurements and quantitative analysis of the hominin crania
The Xujiayao hominin fossils were scanned using high-resolution computed tomography with the following parameters: 190 kV, 130 μA and a resolution of 37.56 μm. Three-dimensional (3D) reconstruction and cranial measurements were conducted in VGSTUDIO MAX 2023.1 (Volume Graphics). A total of 26 linear distances, 3 cranial angles and 2 indices were obtained (Supplementary Table 17). The definitions and measurement follow standard procedures described in the published literature75,76.
Comparative fossils or models were digitized using a 3D surface Scanner (Artec 3D) at a point accuracy of 50 μm. Metric data for these specimens were collected and further supplemented as needed. The comparative samples include East and Southeast Asian H. erectus, African, European and South Asian H. heidelbergensis/early Neanderthals, East Asian late Middle/Late Pleistocene archaic Homo, Neanderthals and modern humans (Supplementary Table 18).
Principal component analysis was performed on key linear distances, angles and indices, including maximum cranial breadth (XCB), biporionic breadth (POB), porion-bregmatic height (PBH), parietal sagittal chord (PAC), parietal subtense (PAS), occipital sagittal chord (OCC), occipital subtense (OCS), parietal angle (PAA), occipital angle (OCA), po-b height-cranial breadth index (PBH/XCB) and parietal curvature index (PAC/PSA). A correlation coefficient matrix was applied for variable standardization in principal component analysis, which effectively reduced biases caused by inconsistent scales among different types of indicators. Box plots were used to visualize the parameters, showing significant variation across taxonomic groups (PAA, OCA, PBH/XCB and parietal bone thickness). One-way analysis of variance was used to detect differences among groups; with P values are displayed on the box plots. All statistical graphics were generated using R (v.4.1.1)77 using the packages ggplot2 (ref. 78), dplyr79 and ggpubr80.
Ethics statement
The Institute of Vertebrate Paleontology and Paleoanthropology, Chinese Academy of Sciences has authorized the protein analyses of Xujiayao hominin fossils.
Reporting summary
Further information on research design is available in the Nature Portfolio Reporting Summary linked to this article.
Check back often for more exciting news!