We live in a time when mixed messages about vaccines are the norm. Often, the Trump administration says one thing, while public health officials say another, leaving at least half of Americans in what the independent health policy organization KFF called the “malleable middle.” They remain uncertain when presented with vaccine myths. To address the
We live in a time when mixed messages about vaccines are the norm. Often, the Trump administration says one thing, while public health officials say another, leaving at least half of Americans in what the independent health policy organization KFF called the “malleable middle.” They remain uncertain when presented with vaccine myths.
To address the confusion, the free “What’s the Risk?” tool launched in early August. It allows users to visualize the vaccine risks often described as “rare” or “uncommon” right alongside the risks associated with the diseases they were created to prevent.
The interactive tool was designed by the University of Minnesota’s Center for Infectious Disease Research and Policy and Unbiased Science, a public health communication platform and podcast founded by Jessica Steier, a public health scientist.
More comparisons will be added over time, but right now, you can see the measles and the MMR vaccine and RSV alongside its vaccines and antibody products. Plus, you can compare them to life events, such as deaths caused by drowning, car crashes, falls, bee or wasp stings and lightning strikes.
How to use the vaccine risk tool
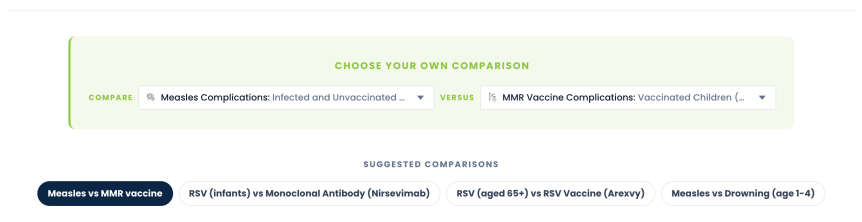
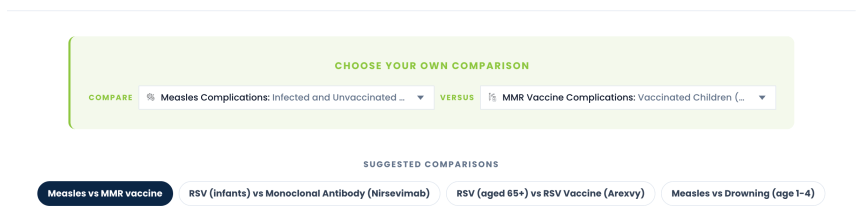
First, choose one of the suggested comparisons or build your own by selecting two from the dropdowns.
But before you scroll down to see the comparison, Steier told CNET in an email that you should read the “Before you compare: a few things to know” list at the top. It explains, for example, that what happens if you get infected versus what happens if you get vaccinated aren’t equally likely. For the former, it depends on many factors, such as where you live and travel and how many people around you are vaccinated.
“They tell you what each side of the comparison is holding constant, and that shapes how you should read everything below it,” Steier said.
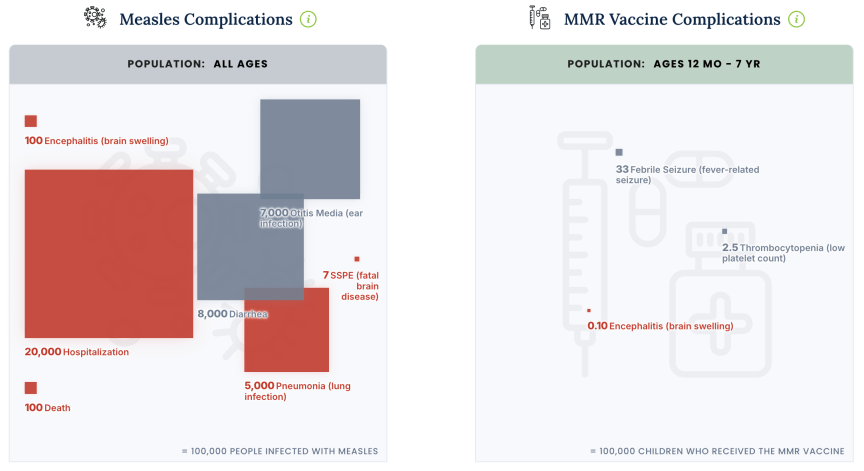
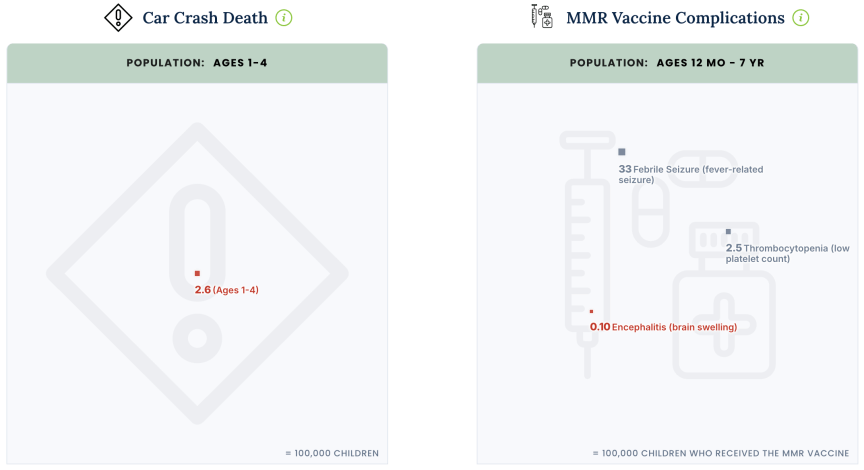
Scroll down to view the two side-by-side light gray boxes. Each represents 100,000 people in the population indicated above the boxes in color-coded bands. Comparisons are most reliable when comparing the same population, so when two different age groups are shown, you should treat the results as a rough sense of scale rather than a precise number.
Plus, these are population averages. Your personal risk will depend on your age, health status and lifestyle circumstances.
All numbers are shown as an annual rate, unless labeled otherwise. Since everyday risks are usually published as lifetime figures, those had to be converted.
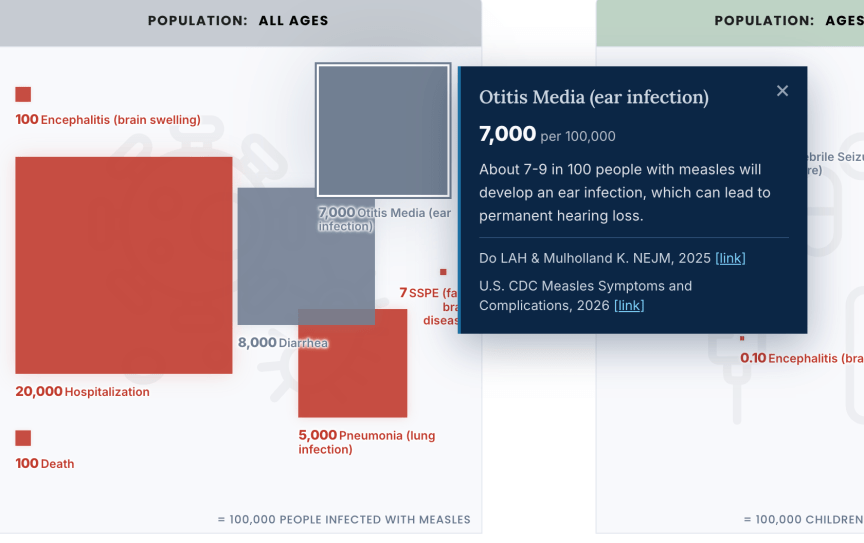
Within the light gray boxes, you’ll find colored squares representing each risk. They’re sized to indicate the number of people affected by the stated complication. “A very rare outcome shows up as a tiny speck and a common one as a large block,” said Steier.
Each square has a color meant to illustrate the severity of the outcome. Red indicates serious outcomes, while dark gray indicates those considered mild or temporary.
If you hover over a square or tap on it, you can read the details and see links to the sources for the number shown by the square.
Above the squares, you can switch to a grid view for a different perspective. You can also zoom in to see the risks represented in a population of 50,000.
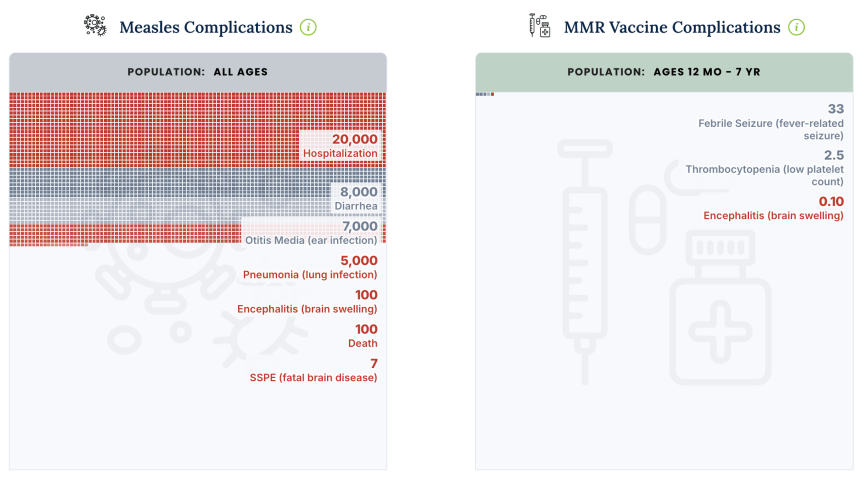
Ultimately, this tool takes numbers that can be difficult to contextualize and helps you visualize them to better understand the relative frequency and severity of vaccines versus their connected diseases.
How sources were chosen
To narrow down the sources for this tool, two rules were applied. “Every figure has to come from a public, citable source, and every figure has to be measured the same way as the one sitting next to it,” said Steier.
For the first rule, the tool’s creators went straight to the source: national surveillance systems and published studies, rather than news articles, fact sheets or advocacy pages that merely cited the original data. The tool links out to these sources, in case you’d like to check their work.
The makers also matched both the vaccine and disease sides based on age group and population as closely as available data allowed. Where that match isn’t exact, the tool says so.
The goal
A single number or statistic won’t typically tell you everything you need to know when it comes to vaccine or disease risk. According to Steier, to understand a risk, you need three things: how likely the outcome is, how serious it would be if it happened, and what it compares to, including what happens if you do nothing.
“Part of what we’re up against is numbness,” said Steier. “Everyone throws scary numbers around constantly, so we’ve stopped registering them. ‘One in 10,000’ and ‘one in a million’ both just land as ‘rare,’ even though one is a hundred times the other.”
The hope with this tool is that users will better understand what those numbers actually mean and develop a habit of asking “compared to what?”
The tool’s future
In addition to working on the design and functionality, the team behind “What’s the Risk?” plans to add more vaccines and diseases. Plus, everyday life events, since those help people put an unfamiliar risk on a scale they already understand.
“The addition we’re most excited about is a way to reflect vaccine coverage, because coverage is what drives how likely you are to encounter these diseases in the first place,” Steier said. This could involve pulling in vaccine uptake by ZIP code so people can view their community, or a slider that lets users adjust vaccine coverage to see how disease risk changes.
This expansion would show that many of us live with a low risk of disease because of the number of people around us who are vaccinated.
Steier emphasized that the current version of the tool is merely version 1.0, so if you see anything that can be improved, you can email the team at vaccines@unbiasedscience.com.

See full bio
Keep following us for the latest insights.