Ethical approval Before commencement of the analysis, approval was obtained following review by the Privacy Risk and Impact Assessment (PRIA) governance body of the bank. Following an initial review by a Data Privacy Manager and a Data Privacy Risk Specialist, the application underwent an additional review by a Group Data Protection Officer, in accordance with
Ethical approval
Before commencement of the analysis, approval was obtained following review by the Privacy Risk and Impact Assessment (PRIA) governance body of the bank. Following an initial review by a Data Privacy Manager and a Data Privacy Risk Specialist, the application underwent an additional review by a Group Data Protection Officer, in accordance with the governance procedures of the bank for projects involving data relating to vulnerable customers. The reviewers were assigned according to the standard PRIA governance procedures of the bank and were independent of the project team. The PRIA application for this project was submitted in March 2024, and approval was granted in August 2024. The body approved use of the data in line with the project proposal for the publication of research entering the public domain. Customers were informed through the privacy notice of the bank51 at account opening that their personal data may be used for behavioural segmentation to better understand customer needs and that aggregated research findings and insights may be shared beyond the bank. Although the data privacy notice of the bank covers the use of customer data for research purposes, customers retained their existing rights to request the erasure of, or object to the processing of, their personal data, and use of their data for research was not a requirement of holding an account.
Sample selection
Primary matched sample
We created two samples for this analysis, victim-survivor (VS) and control, constructed from the customer base of one of the largest retail banks in the United Kingdom, with 28 million customers in 2025 (ref. 52).
The filtering criteria applied to both groups were as follows: (1) women at least 18 years old at the start of the individual-specific 7-year period; (2) who have a current (checking) account; (3) who have not held a joint current (checking) account with another individual in the sample (4) who had at least 6 average monthly transactions within each year across their current (checking) and credit card accounts. The sample is restricted to women, as 87% of VS disclosing financial abuse to the bank identify as female.
First, we identified a sample of women who, between 2020 and 2024, disclosed to the specialist domestic and financial abuse team of the bank that they have been a VS of domestic or financial abuse (n = 9,728). The VS candidate sample is defined as the subset of this sample who have met the above filtering criteria (n = 5,444).
At the time of this analysis (May 2025), transactional data histories span 10 years (May 2015). Therefore, for those with a disclosure date in or after June 2022 (85% of the VS sample), the individual-specific analysis period is defined as the 7-year period preceding the disclosure date. For the remaining sample, for which we do not have access to the full 7 years’ worth of history, the earliest analysis month is May 2015. For this subsample, the shortest history available is 73 months, or just over 6 years.
Next, we constructed a group of control candidates using the following approach. From all female bank customers, we randomly selected an initial pool of 334,642 individuals. Applying the second and third restrictions reduced this control candidate sample to 263,638. We then randomly assigned a ‘disclosure date’ to all control candidates, sampled from the distribution of VS disclosure dates. With the exact analysis period now defined for all control candidates, we then restricted this sample to individuals who met our full inclusion criteria specified above (n = 45,702).
Finally, we performed propensity score matching, using the following matching variables: year and month of the individual-specific analysis period, age, median monthly credit turnover (sum of all credit to the individual’s account, excluding inter-account transfers and refunds; proxy for income), median monthly number of transactions, deprivation rank of the geography where the individual lived53, average credit score, flags for the receipt of the following benefits: child benefit, employment support allowance, disability living allowance and flags for the individual holding the following internal bank products: mortgage, credit cards and loans.
Except for age and deprivation rank, which were calculated in the first month, we used the first year of the analysis period to construct these variables. Propensity scores were estimated using the MatchIt package (v.4.5.5) in R (v.4.3.0) with a generalized linear model with a logistic link function. Matching was performed using nearest-neighbour matching with a 1:3 treatment-to-control ratio, a calliper of 0.1 and without replacement.
This process resulted in a final sample of 5,428 VS and 15,602 control individuals, and a combined sample of 21,030 individuals. Matching weights from the propensity score matching have been applied in all subsequent analyses reported. The analysis periods range between May 2015 and December 2024.
Supplementary Figs. 4 and 5 show the distribution of the matching variables listed above across samples, and Supplementary Table 8 shows the output of the propensity score matching.
Distress-matched and relationship-end-matched samples
We applied the same filtering criteria as described above to create the distress-matched and relationship-end-date samples. Owing to changes in the data retention policy of the bank, at the time these analyses were conducted (January 2026), transaction histories used in the analyses below were restricted to 7 years. The analysis periods range between January 2019 and December 2024. Matching in the following analyses was performed using nearest-neighbour matching with a 1:3 treatment-to-control ratio, a calliper of 0.01 and without replacement.
We created the distress-matched VS (n = 5,387) and control candidate (n = 76,083) samples by applying the same filtering criteria as described above. To create a matched sample, we used variables capturing financial distress and matched the two samples at the end of the analysis period (12 months before disclosure date), to create a control sample that experienced similar levels of financial distress as the VS sample in the period preceding disclosure. We used the following matching variables: year and month of the individual-specific analysis period, age, median monthly credit turnover, median monthly number of transactions, deprivation rank of the geography where the individual lived, average credit score, credit score 12 months before disclosure, average monthly number of rejected direct debits and overdraft charges, average loan, savings and planned overdraft balances, binary flags for the following: savings, loan accounts, usage of planned overdraft, unpaid direct debit and overdraft charges.
The propensity score matching process resulted in a final sample of 5,183 VS and 13,430 control individuals. Supplementary Table 9 shows the output of the propensity score matching.
To create the relationship-end-date samples, we extracted relationship-end date information from the VS candidate sample. Applying the same criteria as described above, we retrieved notes associated with 5,303 victim-survivors. During appointments, with the customer’s consent, bank staff record key details of each case in the form of notes. The richness of the information recorded varies by note, but some include temporal markers, most commonly the relationship end date. We identified 3,559 notes that contained words indicative of a relationship end date. These records either included month names (for example, ‘jan’) or any of the following search words: fled, split, ended, ago, left. We then manually reviewed these notes and extracted relationship end dates with month-level precision. For example, ‘relationship ended 3 years ago’ was not accurate enough, but ‘fled 2 weeks ago’ would be included with a relationship end date 2 weeks before disclosure. We retrieved the latest known contact date with the abuser at the time of the disclosure, and only if it was within our analysis period (after January 2019). Therefore, relationship end could be missing if it was not mentioned in the note, was too long ago, was not specific enough or if the victim-survivor was still in the relationship at the time of disclosure. Manual review resulted in a sample of 1,189 VS sample candidates. On average, relationships ended 7.7 months (s.d. 9.3) before the disclosure date.
The matching variables were the same as those used in the primary matched sample, the only difference being that the individual-specific analysis period was now defined by the relationship end date as opposed to the disclosure date. The propensity score matching process resulted in a final sample of 1,149 VS and 3,236 control individuals. Supplementary Table 10 shows the output of the propensity score matching.
Bank population prevalence estimates
To contextualize the VS–control differences reported in the year before disclosure, we created two alternative samples, a random sample of all bank customers (bank population benchmark) and a random sample of female customers (female bank population benchmark). We have randomly selected an initial pool of 48,758 individuals for the bank population benchmark sample and 48,400 women for the female bank population benchmark sample. Applying the second and third restrictions reduced these control candidate samples to 38,492 and 38,449, respectively. We then randomly assigned a ‘disclosure date’ to all benchmark candidates, sampled from the distribution of VS disclosure dates. With the exact analysis period now defined for all benchmark candidates, we then restricted this sample to individuals who met our full inclusion criteria specified above, with the exception of the gender restriction for the bank population benchmark sample (19,059 and 18,906, respectively). Finally, we then retrieved the corresponding estimates for the 373 outcome variables analysed and 15 demographic variables. The estimates are reported in Supplementary Table 4. This analysis took place in January 2026. Supplementary Fig. 6 shows the distribution of VS and female bank population benchmark average credit scores in the year before the disclosure month.
Transactional and non-transactional outcomes
We retrieved the current account and credit card holdings of VS and control individuals in the matched samples within the individual-specific analysis period. Sole and joint accounts associated with an individual were both included. Next, transactions associated with these accounts in the relevant analysis period were retrieved. A transaction was defined as any credit or debit that occurred on a personal current checking or credit card account, including electronic transfers, online transactions and cash withdrawals using an ATM. Overall, in the largest, primary matched sample, 99% of the 162 million debit and credit card transactions retrieved were classified by the internal transaction classification system of the banks into 455 transaction categories. Using information on the nature of the transaction, we created seven additional derived transactional categories: ATM withdrawal, internal overdraft, internal credit card interest charges, cash advance (credit-card-specific), unpaid direct debit, unpaid cheque, and unclassified for any other remaining transactions. Credit scores range between 0 and 1,344 in the primary matched sample.
From these 462 categories, we kept only those in which at least 1% of the overall, primary matched sample had a transaction during our analysis period, resulting in 353 transaction categories. For our subsequent analyses involving transaction data, we converted monthly transaction count data into a binary format to capture the presence or absence of a transaction in a specific month.
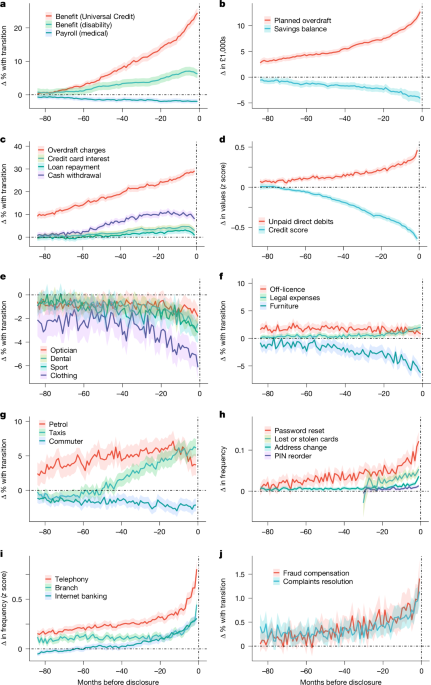
Apart from the 353 transactional categories, 20 additional, non-transactional variables were retrieved. We used the same approach when retrieving transactional and non-transactional variables for the distress- and relationship-end-matched samples and focused on the 353 transactional and 20 non-transactional categories identified in the main analysis. These are a mix of binary and frequency indicators, including, but not limited to, product holdings, overdraft use, interactions with the bank, password and address changes. Unlike transactional variables, not all of these variables were available for the entire analysis period: unplanned, planned overdraft, credit score, internet banking, branch, telephone visits and reported fraud are only available from June 2015 (January 2019 in the distress- and relationship-end-matched samples), complaints frequency are only available from March 2017 (January 2019 in the distress- and relationship-end-matched samples), and PIN reorders and lost or stolen cards are only available from June 2022 (January 2023 in the distress- and relationship-end-matched samples). The full list of 373 financial variables constructed can be found in Supplementary Table 3. Across selected transactional and non-transactional variables, VS–control differences are shown in Fig. 1 (primary matched sample), Supplementary Fig. 2 (distress-matched sample) and Supplementary Fig. 3 (relationship-end-matched sample).
Testing group differences
The primary analysis was conducted between September 2024 and July 2025, whereas the additional analyses, including the distress- and relationship-end-matched samples, were conducted between December 2025 and January 2026. The analysis considered three pre-disclosure periods: 7–3.5 years, 3.5–0 years, and 1 year before disclosure. For transactional outcomes, weighted proportions of individuals with at least one transaction in each category during each period were compared between groups using weighted χ2 statistics. For non-transactional outcomes, an individual-specific average value was first calculated within each period, and weighted group means were compared using t-statistics. Statistical significance was assessed using two-sided permutation tests54 by randomly permuting group labels (1,000 permutations for transactional outcomes and 500 permutations for non-transactional outcomes). Because statistical inference was based on permutation tests rather than reference distributions, degrees of freedom are not reported. P-values were adjusted for multiple comparisons using the Benjamini–Hochberg false discovery rate procedure55. Analyses were conducted in R (v.4.3.0) using the survey package (v.4.4-2).
Analysis of the dynamics of group differences
To identify persistent group differences over time in the primary matched sample, for each outcome (n = 373) and time point (n = 84) pair, we ran a series of linear regressions with ordinary least squares estimation using group membership as a predictor. The analysis generated a two-dimensional matrix of t-statistics, representing the temporal evolution of group differences relative to the disclosure date for each outcome.
Next, we selected temporal t-statistics cluster candidates that exceeded 1.96 (corresponding to P = 0.05 for a two-sided test). To control for multiple comparisons through the familywise error rate56,57, we then generated joint null distributions of the largest absolute cluster sums through 1,000 permutation iterations and retained only candidate clusters significant at P < 0.001 (two-sided). Figure 2 shows the significant temporal clusters identified for individual financial indicators, and Fig. 3 summarizes the timing and magnitude of these clusters by financial indicator group. These analyses were conducted in Python (v.3.12.2) using the glmtools (v.0.2.1) and MNE packages58 (v.1.7.1).
Representativeness of the Lloyds Banking Group customer base
We identified those bank customers who had at least 12 transactions per month across their current (checking) and credit card accounts in the year 2024 (n = 15,177,227). For this sample, we then retrieved the following information in December 2024: gender, age, deprivation rank, region and joint account status. Population statistics by age, gender, and region and median household disposable income estimates for the United Kingdom were obtained from the Office for National Statistics (ONS)59,60. Median annual credit turnover (bank proxy for income) is approximated using monthly median credit turnover calculated for the period between October and December 2024 using data from individuals holding joint accounts (n = 5,615,574) to provide a suitable comparison with household-level median disposable income in the United Kingdom in 2024. The comparison can be found in Supplementary Table 1.
Representativeness of the VS sample
We assessed the representativeness of the VS sample by comparing the distribution of key demographic characteristics—age group, region of residence and disability status—with corresponding estimates from a nationally representative survey. Comparisons were restricted to victim-survivors residing in England and Wales to align with the geographic coverage of the survey benchmarks, which together comprise about 89% of the UK population. Age in the Lloyds Banking Group (LBG) sample was calculated as of December 2024. Variables were selected based on the availability of comparable measures across data sources. Supplementary Table 10 presents the percentage distribution of these characteristics for the VS sample restricted to England and Wales (n = 4,875) alongside the corresponding ONS estimates. The LBG sample includes women aged older than 18 years at the start of the 7-year analysis period. Consequently, the youngest participant was 25 years old in 2024. In the LBG sample, disability is inferred from disability benefit receipt.
Financial product applications and application outcomes
For the VS (n = 5,428) and control samples (n = 15,602), we retrieved information on applications for financial products and their outcomes during the analysis period. Application data were available for credit cards, current (checking) accounts, loans, mortgages and savings products. Monthly weighted differences in the proportion of individuals submitting applications and the proportion with successful applications were calculated between the VS and control groups relative to disclosure. The resulting time series are shown in Supplementary Fig. 1.
Measuring the impact of the filtering criteria
To assess the impact of the four filtering criteria of the VS sample, we examined whether age at the start of the analysis period and changes in deprivation rank and average credit score over the analysis period differed by inclusion status. We compared the final VS candidate sample (n = 5,444) with those who were filtered out (n = 4,284). These characteristics were selected because they are independent of account activity. The comparison is shown in Supplementary Table 12.
Measuring the degree of self-selection by financial distress
To investigate whether the VS group (n = 5,428) was composed predominantly of individuals experiencing financial distress, we compared the distribution of average credit scores during the year before disclosure between the female bank population benchmark (see ‘Female bank population prevalence estimates’; n = 18,906) and the VS sample. Supplementary Fig. 6 shows the resulting kernel density estimates.
Reporting summary
Further information on research design is available in the Nature Portfolio Reporting Summary linked to this article.
Check back often for more exciting news!