
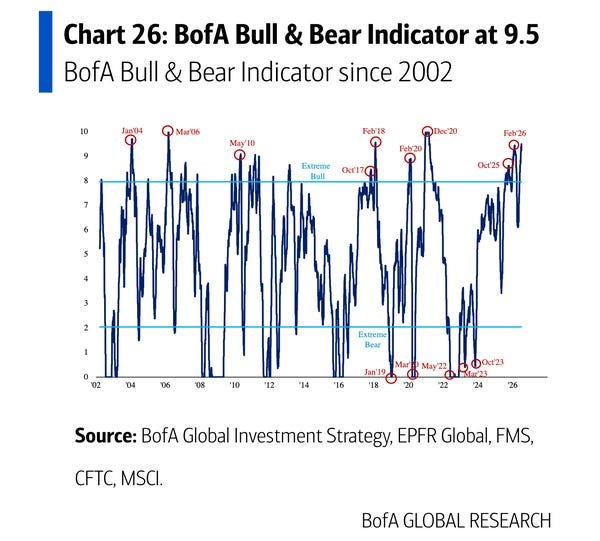
Bank of America’s Bull & Bear indicator just issued its biggest “sell” signal since at least 2021. “Extreme bullish positioning says risk exposure is reduced,” Michael Hartnett, the bank’s chief investment strategist, said in a note on Friday. The indicator takes into account the positioning of hedge funds, stock and bond flows, stock index breadth,
Bank of America’s Bull & Bear indicator just issued its biggest “sell” signal since at least 2021.
“Extreme bullish positioning says risk exposure is reduced,” Michael Hartnett, the bank’s chief investment strategist, said in a note on Friday.
The indicator takes into account the positioning of hedge funds, stock and bond flows, stock index breadth, positioning of fund managers and technical indicators of the credit market. When these indicators show that investor sentiment is too exuberant, they send a contrarian sell signal.

bank of america
The signal is not necessarily a predictor of large and prolonged sell-offs in the broader market. Rather, it tends to signal a short-term danger.
For example, after its peak in February of this year, the S&P 500 fell more than 7%; However, since the end of February the market has risen 9%. And at its peak in May 2010, the market suffered a 9% “flash drop,” but the broader uptrend remained intact.
According to Bank of America, there have been 17 sell signals since the Bull & Bear indicator was launched 24 years ago.
Hartnett said the average sell-off for the MSCI All Country World Index after a sell signal has been 2% to 3% over the next two to three months, and that stocks have fallen 60% of the time. Peak declines in subsequent months have been in the 15% to 20% range, Hartnett said.
In May, Hartnett warned of a potential bubble in stocks and said consumer staples, financials and healthcare stocks should outperform. In recent weeks, the bank also said the S&P 500 could see a correction in the third quarter.
Morningstar has also recently pointed out a worrying indicator of investor sentiment: the stellar performance of the S&P 500 Momentum Index. In April and May, it had its best bimonthly run of profitability since at least the mid-1990s, surpassing the peaks seen during the dot-com era.
Since the Momentum Index includes stocks that have performed well recently, it acts as a de facto indicator of the level of FOMO in the market.
“I think it’s a sign that there could be excessive optimism in the market today, so I think it leaves us with a cautious outlook for the markets going forward,” Morningstar Wealth CIO Philip Straehl told Business Insider this week.