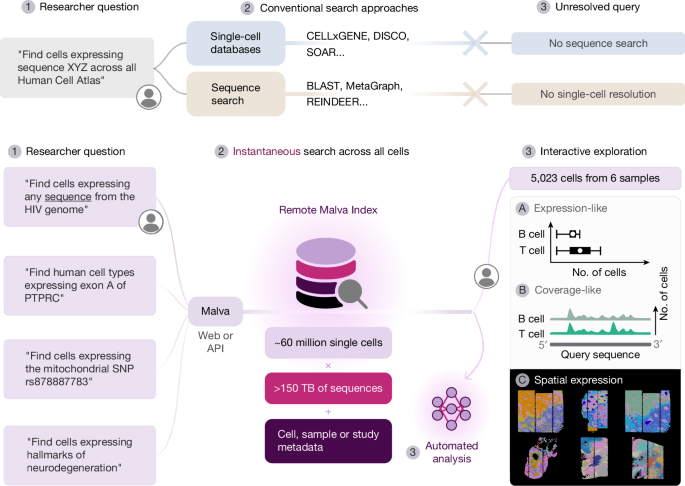
The Malva platform Malva provides a unified interface to search millions of cells by any RNA sequence. Malva integrates five modular components that operate independently but communicate through a central orchestrator (Extended Data Fig. 1b). When a user submits a query via the public RESTful API—a gene symbol, DNA sequence, or natural language request such
The Malva platform
Malva provides a unified interface to search millions of cells by any RNA sequence. Malva integrates five modular components that operate independently but communicate through a central orchestrator (Extended Data Fig. 1b). When a user submits a query via the public RESTful API—a gene symbol, DNA sequence, or natural language request such as “cells expressing markers of neurodegeneration”—it is routed by a central orchestrator. Natural language queries first pass through an integrated language model that translates biological concepts into gene sets. The search engine then decomposes sequences into k-mers and queries our distributed index, leveraging pre-computed results for common genes. Malva Index returns cell identifiers with expression levels or coverage profiles, which are then enriched by a metadata service that appends standardized cell-level (for example, cell-type annotation) and sample-level (for example, tissue, disease and developmental stage) annotations. This enables users to filter results or perform targeted searches on specific sample subsets. The platform can also expand datasets available in Malva Index: a crawler monitors public repositories (GEO, SRA, HCA Data Portal and ENA) for new datasets, which are asynchronously processed into separate Malva Index instances and progressively merged into the searchable corpus. Load balancing across multiple workers ensures consistent performance even as hundreds of users query simultaneously. Results return in standard formats (JSON, h5ad) ready for downstream analysis in familiar tools such as scanpy, with full metadata to enable further filtering and aggregation. The server code operates on a standard, open-source stack of tools (Flask v3.1.0, numpy v2.2.6, pandas v2.3.2, SQLite v3.49.1 and polars v1.27.1).
Data sources, crawling and availability
Malva Index incorporates public single-cell and spatial transcriptomic datasets from major repositories (Human Cell Atlas, GEO, SRA, ENA, ArrayExpress and CNGBdb). Data are ingested into Malva Index via the malvacrawl service. The service maintains a registry of datasets identified primarily from the Human Cell Atlas Data Portal, supplemented by automated parsing of GEO and ENA metadata feeds, and manual ingestion of selected identifiers from other platforms (such as ArrayExpress or CNGB). Each candidate dataset is assigned an internal UUID (universally unique identifier) and checked against existing entries by GEO or ENA accession to prevent duplication. Because deposited metadata are frequently incomplete or inconsistent (for example, the sequencing technology or barcode format is often not specified), malvacrawl utilizes a two-stage annotation strategy. First, a large language model (instruction-tuned Llama 3.1) performs an initial parse of the dataset description, extracting candidate technology, organism and tissue labels. Second, these candidates are manually curated and mapped to a controlled ontology using text2term v4.5.0 (see ‘Metadata standardization’). For raw data acquisition, malvacrawl attempts to download FASTQ files via SRA prefetch, HTTP, or FTP in order of preference, using sra-tools (v3.4.1). For datasets archived as BAM files, we converted them back to FASTQ using bamtofastq (v1.4.1). Barcode and sequence parsing during preprocessing relied on dnaio (v1.2.4). For barcoded technologies (primarily 10x genomics), paired-end data are expected; therefore, if only a single FASTQ file is available, or only BAM files are archived, these BAM files are downloaded and converted back to FASTQ using standard 10x conversion utilities. The technology is identified either from deposited metadata, from the structure of the R1 read (barcode length and whitelist match rate), or, when ambiguous, via manual inspection. Datasets that are not compatible with Malva’s whitelist-based barcode system (see ‘Barcode preprocessing’) are deferred for future integration. For non-barcoded, plate-based assays (for example, Smart-seq2), each FASTQ file comprises one cell, and datasets are ingested in ‘bulk’ mode as per-cell indices, and later merged into a sample-level index that preserves cellular resolution.
Currently spanning ~60 million cells from thousands of experiments, Index includes diverse technologies (10x Chromium, Visium, Open-ST, Stereo-seq, Smart-seq2) across multiple organs, species, and conditions. The platform runs on-premise infrastructure with query limits to ensure consistent performance for all users.
Querying
Malva maintains local databases to translate user queries into searchable sequences. When users query gene symbols or Ensembl IDs, these are mapped to genomic coordinates on standard reference genomes (hg38 for human, mm10 for mouse) with default repeat masking55. For expression queries, we retrieve full transcript sequences from Ensembl. For coverage queries that visualize read distribution along genes, we use the genomic coordinates to define the region of interest and return k-mer matches at each position.
Several specialized databases support specific semantic biological queries. To support these via natural language, we integrated Llama 3.1 via Ollama as a translation layer between user prompts and gene sets56. The language model is optionally augmented with a Retrieval-Augmented Generation (RAG) database built from MSigDB57, which includes curated gene sets from Reactome, Gene Ontology (GO) and other pathway databases. When users submit queries such as “inflammatory response genes in macrophages”, the system retrieves relevant gene sets from MSigDB and uses the language model to refine the selection based on the specific query context. This approach provides a convenient interface for exploring biological concepts without requiring users to manually compile gene lists. The resulting gene sets are converted to sequences and searched across Malva Index like any other query.
Pre-computed gene expression matrices
To accelerate common gene-level queries, we pre-compute and store gene expression matrices for frequently accessed gene sets. For each species in Malva Index, we compile comprehensive transcript catalogues from Ensembl, including all protein-coding transcripts, non-coding RNAs, and 3′ UTR sequences. We then query Malva Index with these reference sequences to generate pseudocount matrices for every indexed dataset.
The pre-computation process aggregates k-mer counts across all isoforms of each gene, producing a cell-by-gene matrix analogous to standard single-cell expression matrices. These matrices are stored in a distributed database indexed by gene symbol, Ensembl ID, and dataset identifier. When users query common genes through the API, the system retrieves pre-computed values directly from the database rather than searching the k-mer index, reducing query latency from seconds to milliseconds. The database is updated incrementally as new datasets are added to Index, ensuring that gene-level queries always reflect the complete corpus of indexed data. For custom non-standard gene symbols, the system falls back to real-time k-mer queries, maintaining flexibility while optimizing performance for common use cases.
Metadata standardization
Critical to the ability of Malva to aggregate results across studies is the harmonization of heterogeneous metadata from diverse sources (HCA Data Portal, GEO, SRA, ArrayExpress and CNGB). Raw metadata arrives in various formats with inconsistent naming conventions, where identical biological entities may be described using different terminologies across repositories. Similarly, developmental stages, disease states, and experimental descriptors vary widely between data sources.
We implemented an automated standardization pipeline based on text2term v4.5.058, a specialized biomedical ontology mapping tool that utilizes semantic similarity algorithms to map free-text metadata terms to established ontology standards. The pipeline first preprocesses metadata by standardizing null values and normalizing common terminology variants. Multi-value fields containing multiple biological conditions are decomposed and mapped individually to ensure comprehensive coverage. The system then applies TF–IDF (term frequency–inverse document frequency)-based semantic matching with hierarchical fallback strategies to map terms to domain-appropriate ontologies: diseases to MONDO, anatomical structures to UBERON, phenotypic traits to PATO, and developmental stages to age-related ontologies. To enable system-level biological analysis, organs are additionally mapped to their hierarchical parent anatomical systems through ontology traversal within UBERON. This multi-layered semantic harmonization approach ensures that functionally equivalent terms from different repositories are mapped to identical standardized identifiers, enabling robust cross-study aggregation and systematic biological queries while preserving both granular and hierarchical biological relationships.
Cell-type classification
To enable aggregation of query results at the cell-type level, we implemented an automated annotation pipeline for all indexed cells. Author-provided cell-type labels are often heterogeneous across studies or entirely absent in many submissions. To address this, we perform de novo annotation using a two-stage approach.
First, we apply a marker-based scoring system. We compiled curated marker gene sets for major cell types following Cell Ontology classifications, with each cell type defined by 10–20 literature-validated markers. We then perform clustering using standard methods (principal component analysis (PCA), k-nearest neighbours, Leiden algorithm via leidenalg v0.10.2) and identify differentially expressed genes for each cluster. Across clusters, we calculate enrichment scores for each type signature; thus, clusters are assigned cell types based on the differential expression of marker genes, considering both the number of expressed markers and their specificity to the cluster.
Second, we refine these cluster-based annotations using a language model that integrates biological context, as previously described59. The model receives the top differentially expressed genes for each cluster along with metadata (marker-based cell-type annotation, tissue origin, developmental stage, disease state) and produces refined cell-type assignments. To ensure biological accuracy, the model evaluates whether each annotation is plausible given the tissue context, flagging unlikely assignments for correction. We mapped the output cell-type annotations to a predefined, controlled vocabulary based on the cell ontology standard.
Natural language query interface validation
To systematically evaluate the accuracy of natural language query translation, we generated 10,000 synthetic test cases using gpt-oss:120b as a test case generator, ensuring independence from our production model (Llama 3.1 8B). Test cases were distributed across eight categories: simple gene queries (15%), gene queries with filters (20%), marker gene requests (15%), sequence searches (10%), database identifier lookups (10%), pathway queries (10%), unsupported queries (7%), and over-inference traps (15%). Over-inference traps were specifically designed to test whether the model inappropriately adds biological context as filters (for example, adding ‘T cell’ filter when querying FOXP3 without explicit cell-type specification).
We evaluated four metrics: query type accuracy (correct classification into the eight categories), gene list F1 (harmonic mean of precision and recall for extracted gene names), filter precision (fraction of returned filters that were explicitly stated in the query), and filter recall (fraction of explicitly stated filters that were captured). The complete set of 10,000 evaluation queries, together with expected outputs and the prompts used during instruction-tuning of the production model, are publicly available (Data availability).
In the production environment, categorical metadata filtering (for example, resolving a user’s tissue or disease term to standardized ontology values) is performed via a hybrid approach. First, the input term is matched against a fuzzy dictionary built from all unique values in the metadata store, using Levenshtein distance with a configurable threshold. If no confident match is found, the system falls back to vector similarity search against a sentence-embedding database (built with the same model used for ontology mapping), returning the nearest ontology term above a cosine similarity threshold.
Malva Index architecture
Malva Index organizes single-cell sequencing data as a searchable collection of k-mers (fixed-length nucleotide sequences) linked to their cellular origins. Each sequencing read is decomposed into non-overlapping k-mers of length k (default k = 24), with a final overlapping k-mer to ensure complete sequence coverage. Specifically, for a sequence of length l, we extract k-mers at positions 0, k, 2k, …, plus one k-mer starting at position l − k if needed. The use of non-overlapping k-mers rather than minimizer-based sampling is a purposeful design choice. We acknowledge that minimizers were developed to guarantee shared k-mers between overlapping sequences (essential for assembly); however, Malva’s windowed query strategy already ensures full sensitivity for queries with ≥2k nucleotides (see ‘Sequence querying and pseudoquantification’). Importantly, non-overlapping sampling greatly reduces indexing time and memory cost, provides uniform detection probability and simplifies index merging to a union operation.
Each k-mer is encoded as a 64-bit integer using 2-bit nucleotide encoding (A = 00, C = 01, G = 10, T = 11), enabling efficient storage and comparison. The cellular origin is tracked through a composite identifier that encodes both the cell barcode and dataset source. We allocate the upper bits for dataset identification and lower bits for cell-specific barcodes; for example, using 8 bits for dataset ID and 24 bits for cell barcodes allows indexing up to 256 datasets with ~16 million cells each. This hierarchical encoding enables queries to return both the specific cell and its source dataset.
Malva Index uses a two-tiered structure optimized for sequence search conceptually similar to inverted indices for web search. The sequence array stores all unique k-mers found across datasets, sorted numerically. The location array contains the composite cell-dataset identifiers where each k-mer appears. These are linked via the pointer array mapping each k-mer to its locations, storing start and end positions within the location array. This design enables rapid lookup: finding all cells containing a specific k-mer requires just one binary search in the sequence array followed by a single read from the location array.
Individual datasets are processed independently before being merged into the unified index. FASTQ files are decompressed and parsed in parallel, extracting cell barcodes and sequences at rates exceeding 2 million reads per core per second. For each dataset, reads are streamed through memory-efficient buffers, extracting k-mers and their associated barcodes. The k-mers are lexicographically sorted and deduplicated, keeping track of all cells where each appears. These dataset-specific indices are then merged hierarchically: smaller indices combine into progressively larger ones using k-way merge algorithms that require minimal memory. This approach enables processing of datasets far larger than available RAM while maintaining near-linear scaling with data size. Detailed algorithmic descriptions of the index chunk generation, chunk merging and query scoring procedures, including pseudocode sufficient for reimplementation, are provided in Supplementary Methods.
To handle indices exceeding available memory, k-mers are partitioned into buckets, each stored contiguously on disk (Supplementary Methods). A lookup structure, always resident in memory, maps k-mer prefixes directly to the disk offset and size of its bucket. Locating a k-mer requires one prefix table lookup followed by a binary search within the bucket, typically fewer than 20 comparisons for billion-scale indices. The prefix table and suffix arrays are accessed via memory-mapped file input–output; cell data blocks are read on demand for each queried bucket.
The final merged index is stored in a compressed binary format optimized for disk-based retrieval. Arrays are partitioned into fixed blocks (512 entries) that are independently compressed using delta-encoding followed by Blosc compression, achieving 10–20× reduction compared to raw FASTQ files (Supplementary Methods). The hierarchical organization enables efficient searches: locating a k-mer on an index with N k-mers in pages of P k-mers requires in the order of logpN page accesses, typically 3–4 disk random reads for billion-scale indices. A small least recently used (LRU) cache maintains frequently accessed pages in memory.
Barcode preprocessing
Cell barcodes are extracted according to technology-specific configurations and matched via exact lookup against whitelists (for example, 10x Chromium v2/v3 barcode sets). All barcode–k-mer associations are stored during indexing. Barcodes with Hamming distance >0 from the whitelist are discarded; error correction is not performed. For technologies that do not provide a vendor-supplied barcode whitelist, such as split-seq or sci-seq variants, barcodes must be resolved as a preprocessing step before indexing. Tools such as flexiplex44, matchbox60, or splitcode61 can convert non-standard barcode layouts into whitelist-compatible R1/R2 FASTQ pairs, after which Malva indexes the data in the standard way. The datasets currently in Malva Index were generated using protocols for which barcodes can be extracted as fixed-length sub-sequences (for example, 10x Chromium, Visium, Stereo-seq), or, in the case of Smart-seq2, where one index per cell is generated and subsequently merged using the malva combine command.
Prior to cell-type annotation, we apply a UMI-based threshold method to retain barcodes that are likely to correspond to true cells, analogous to the order of magnitude (OrdMag) algorithm used by Cell Ranger62: barcodes are ranked by descending total UMI counts, and an expected number of cells is estimated by minimizing the squared relative difference between a candidate cell count x and the number of barcodes exceeding a UMI threshold derived from x. Specifically, for each candidate x, we compute the 99th percentile UMI count among the top x barcodes, divide this value by 10 to obtain a threshold, and count barcodes exceeding this threshold. The optimal x minimizes (f(x) − x)2/x, where f(x) is the count of barcodes above the threshold. Once the expected cell number is determined, the final UMI threshold is set as the 99th percentile of the top barcodes divided by 10, and all barcodes with UMI counts above this threshold are retained as cells.
Sequence querying and pseudoquantification
Malva identifies query sequences by decomposing them into k-mers and searching Malva Index for matches. For queries longer than k, we utilize a sliding window approach to ensure all possible k-mer alignments are considered. Given a query sequence q and window size w (default w = 64), we extract all windows of length w and evaluate the fraction of matching k-mers in each window.
The match score for a window W and cell C is defined as the ratio of matching k-mers to total possible k-mers: \(\mathrmM(W,C)(W,C)=\fracFor more tech updates, stay tuned to our blog.Check back often for more exciting news!\), where M(W,C) represents the set of k-mers in W that appear in cell C. By default, we mask low-complexity k-mers using dustmasker v1.0.0 with default parameters prior to scoring55. Optionally, users can further reduce false positives from repetitive sequences by excluding k-mers that appear frequently across the reference transcriptome; this is achieved by counting k-mer occurrences across all transcripts and ignoring those exceeding a user-specified threshold during query, though this option is not enabled by default. Windows with scores exceeding threshold τ (default τ = 0.65) are considered positive matches. For sequences longer than w, presence in a cell is determined as soon as any single window passes the threshold.
This approach tolerates sequencing errors and mutations: a single nucleotide change affects only one k-mer, allowing the remaining k-mers to drive detection. The complete query process aggregates matches across all windows, returning cells ranked by the number of significant windows. For typical use cases (w = 64, k = 24, τ = 0.65), the method reliably detects sequences with up to ~15% divergence while maintaining low false positive rates. Query optimization includes batching k-mer lookups to minimize disk access and exploiting the sorted index structure for cache efficiency. Complete specifications of the batching strategy, index access patterns, and caching parameters are provided in Supplementary Methods.
Sequence coverage quantification
For coverage analysis, we preserve spatial resolution along transcripts by reporting k-mer matches for each sliding window independently. We apply a sliding average (default window: 24 bp) to smooth the coverage profile, producing visualizations comparable to those from alignment-based tools. As with pseudoquantification, we mask low-complexity k-mers using dustmasker v1.0.055 during coverage calculation to prevent artifactual peaks. Without masking, certain positions can show 100–1,000× spikes due to sequences shared across many genes. This positional information enables detection of alternative polyadenylation sites, splice junction usage, among others.
Benchmarking
We evaluated Malva’s performance against established tools for both indexing speed and query accuracy. For indexing benchmarks, we compared Malva with kallisto-bustools v0.28.222, MetaGraph v0.4.1 (RowDiff/Multi-BRWT variant, indexing only)27, BLAST+ v2.16.0 (MEGABLAST variant, indexing only)63 and a STAR (v2.7.11b)-based workflow23,64, Fulgor v4.0.0 (meta-diff variant)31, and REINDEER v1.4.7-1-g0812ad128, on various datasets ranging sequencing depths and number of unique labels (spatial locations). For sequence search capabilities, we compared against MetaGraph, BLAST+, Fulgor and REINDEER.
For benchmarking of computational complexity, dataset selection varied by method due to architectural constraints: for MetaGraph and BLAST, we used the Stereo-seq CIRSTA mouse liver atlas (CNGBdb accession: CNP0003447), containing ~60 billion reads (7 TB of raw, compressed data) across 20 samples with ~4 billion unique spatial barcodes65. REINDEER and Fulgor require treating each cellular barcode as a separate input file, making analysis of millions of cellular barcodes impractical due to filesystem overhead and preprocessing requirements (REINDEER additionally requires running bcalm66 on each sample independently). We therefore benchmarked these methods on a composite dataset from 6 Visium samples (accession numbers: GSM5115019, GSM5115020, GSM5115021, GSM5115022, GSM5115023, GSM5115024) totalling ~1.5 billion reads (~180 GB of raw, compressed data) across ~30,000 unique spatial locations67, providing comparable read depth while maintaining feasible file counts. These datasets tested the ability to handle varying spatial resolutions (0.6 µm in Open-ST to 55 µm in Visium), sequencing depths, and total data volumes. For large-scale benchmarking, we additionally selected 1% of datasets at random from Malva Index (~1.5 TB of raw data) and reindexed them with Malva and Fulgor, the two methods with best runtime and memory usage during indexing and querying, using identical settings as in other experiments. Each benchmark was run independently and was allocated at most 96 threads and 512 GB of memory on a multi-socket server with Intel Xeon Platinum 8454H CPUs (256 threads total) and 4 TB RAM, with resource monitoring via snakemake v7.32.468.
Validation of biological signal preservation
We evaluated whether Malva’s k-mer-based pseudocounts produce biologically meaningful results comparable to traditional pipelines. We selected representative datasets spanning high- and lower-resolution spatial transcriptomics, healthy and disease samples: an Open-ST tumour section (high spatial resolution, small scale69; SRA accession SRX23008310), 10x v3 embryonic (E13.5) mouse midbrain (mouse single-cell, small scale70; SRA accession SRR11947658), 10x v3 human PBMCs (human single-cell, small scale; downloaded from https://cf.10xgenomics.com/samples/cell-exp/3.0.0/pbmc_1k_v2/pbmc_1k_v3_fastqs.tar), and Visium mouse brain (low spatial resolution, small scale, downloaded from https://s3-us-west-2.amazonaws.com/10x.files/samples/spatial-exp/1.3.0/Visium_Adult_Mouse_Brain/Visium_Adult_Mouse_Brain_fastqs.tar). Across datasets, we compared Malva pseudocounts to the original deposited count matrices. For each, we computed per-cell gene counts and calculated correlations between total counts per gene and per cell.
To assess whether pseudocounts support downstream analyses, we performed clustering on all benchmarked datasets using species-specific Ensembl transcript sequences after masking low-complexity and repetitive k-mers. We applied standard scanpy processing (normalization, log transformation, highly variable gene selection, PCA, nearest neighbour graph construction, and Leiden clustering via leidenalg v0.10.2) and compared cluster assignments between Malva and traditional pipelines using Normalized Mutual Information. Additionally, the clusters from the reference objects were merged to the Malva objects by cell barcode, and used to assess the similarity marker gene detection between Malva and original counts, by applying a Wilcoxon rank-sum tests (one cluster versus the rest), then measured the concordance of the Fold Changes for each gene in each comparison.
For trajectory analysis, we applied the scanpy v1.11.4 implementation of diffusion pseudotime (DPT) on the single-cell E13.5 mouse midbrain dataset71,72. Analyses were restricted to the neuronal subset, and we selected a representative radial glia cell as the root for pseudotime inference. Pseudotime ordering was computed independently on both the Malva pseudocount matrix and the reference UMI-based quantification. To enable direct comparison, we merged results by cell barcode and quantified similarity between pseudotime trajectories.
Simulation of sequencing errors
To evaluate Malva’s robustness to sequencing errors, we introduced synthetic errors into the benchmark datasets (Open-ST human tumour, 10x v3 human PBMCs, and Visium mouse brain) at rates ranging from 0.1% to 10%. These synthetic errors are cumulative to the existing errors of the data induced from the current short-read sequencing platforms. For each error rate, we randomly selected positions within reads and substituted nucleotides with uniform probability across the three alternative bases. We then rebuilt Malva indices from the error-containing reads and repeated our standard benchmarking analyses: per-cell and per-gene correlation with reference counts, clustering agreement (NMI), and marker gene detection concordance. For variant detection benchmarks, we additionally assessed sensitivity and specificity of the cell line mixture probes across error rates using both overlapping and non-overlapping k-mer indexing strategies.
Sequence-based variant detection validation
To validate Malva’s accuracy for sequence-based variant detection, we compared against Flexiplex (v1.02.3), a specialized sequence search tool44, using a seven-cell-line mixture dataset (SRR10971813). The dataset contains known sequence variants: MCF7 cells expressing a BCAS4–BCAS3 fusion gene, HEK293T cells containing adenovirus E1A sequences, and T47D cells carrying mitochondrial SNV rs878887783.
We searched for four target sequences: BCAS4–BCAS3 SNV variant (CCGATCCTGGGGCCGAGGTACCTTTGACAGGAGC), Adenovirus 5 E1A (TTTGGACTTGAGCTGTAAACGCCCCAGGCCATAA) and a rs878887783 probe (ATTACTCCTGCCATCATGACCCCTGGCCATAATATGATTTATCT). Compared to the Flexiplex benchmarking set-up, for the BCAS4–BCAS3 variant, we excluded the reference (CCGAGCCTGGGGCCGAGGTACCTTTGACAGGAGC), as no MCF7 cells are expected to express it. For the mitochondrial variant, we used a truncated version of the original probe as the full sequence from the Flexiplex paper yielded zero counts when following their supplementary protocol, though our modified probe produced similar detection numbers to their reported results.
Flexiplex was run with default parameters using grep-based detection mode. For output processing, we extracted cellular barcodes by matching read identifiers from Flexiplex results to the corresponding R1 FASTQ file and extracting the first 16 nucleotides as cellular barcodes. For Malva, we used a sliding window size of 24 nucleotides with 100% k-mer presence threshold. Malva results directly return cell barcodes and k-mer match counts. Wall-clock time was measured for both workflows including index construction (only in the case of Malva, done once) and query processing (for each probe). Sequence search performance metrics (true positives, false positives and false negatives) were calculated by comparing detected cells against expected cell line identities for each target sequence, from the annotated objects deposited by the authors.
To further validate Malva’s ability to detect clinically relevant somatic mutations, we analysed a lung adenocarcinoma dataset (PRJCA00173173) containing matched tumour–normal pairs with characterized EGFR mutation status. From the archived datasets, four tumours carried EGFR exon 19 deletions and one carried the L858R point mutation (c.2573T>G) in exon 21. We first established ground truth by aligning reads with STAR (v2.7.11b) to GRCh38 and visualizing coverage across the EGFR locus. We then designed Malva probes targeting: (1) exons 18–21 as positive controls for EGFR expression; (2) the wild-type exon 21 sequence; and (3) a 45-bp probe centred on the L858R variant (GTCAAGATCACAGATTTTGGGCGGGCCAAACTGCTGGGTGCGGAA), with a pair-matched wild-type probe (GTCAAGATCACAGATTTTGGGCTGGCCAAACTGCTGGGTGCGGAA). Probes were queried against sample-specific Malva indices with parameters w = 24, τ = 1.0 for variant-specific detection.
Specialized sequence queries across Malva Index
Large-scale arbitrary nucleotide sequence search. To systematically screen for exogenous sequences, we compiled viral genomes from NCBI RefSeq: SARS-CoV-2 (NC_045512.2), hepatitis C virus (NC_004102.1), measles virus (NC_001498.1), West Nile virus (NC_001563.2) and Zika virus (NC_012532.1), as negative controls; HERV-K consensus sequences; PhiX174 (NC_001422.1) as a positive control; and the lentiviral vector pBA439 (AddGene #85967). We queried these sequences against the complete Malva Index with default settings (k = 24, window size = 64, threshold = 0.65) and generated tissue- and study-level coverage profiles. We additionally screened Mycoplasma sequences because these bacteria are frequent, often undetected cell culture contaminants. Literature and guidance documents consistently report a small set accounting for most laboratory contamination events including Mycoplasma hyorhinis, Mycoplasma hominis, and Mycoplasma fermentans in human and other mammalian cell cultures, and also included Mycoplasma agassizii, a respiratory pathogen of turtles, not associated with human or standard mammalian cell culture workflows.
Germline variant query probe design. To systematically screen for germline genetic variants across Malva Index, we generated sequence probes targeting common SNPs in protein-coding regions. We downloaded phase 3 data from the 1000 Genomes Project across human chromosomes 1–22 and filtered for biallelic SNPs with MAF ≥ 1% located within exons or UTRs of protein-coding genes as defined by GENCODE v19 annotations. For each qualifying variant, we extracted the genomic context from the GRCh37 reference genome and constructed 64-nucleotide probes centred on the variant position, generating paired probes containing either the reference or alternative allele.
We annotated variant pathogenicity using ClinVar classifications, categorizing variants as ‘pathogenic’, ‘likely pathogenic’, ‘variant of uncertain significance’ (VUS), ‘likely benign’, ‘benign’ or ‘unknown’ based on clinical significance scores. To enable evolutionary analysis, we incorporated ancestral allele information from the 1000 Genomes Project ancestral sequence alignments, determining whether the reference or alternative allele represented the ancestral versus derived state for each variant. Quality control filters removed probes with extreme GC content (<30% or >70%) to ensure reliable detection. The final probe set contained 296,985 variant pairs spanning all chromosomes.
We queried these variant probes against the complete Malva Index using the standard API, retrieving cell-level match counts for both reference and alternative alleles. For evolutionary analysis, we calculated derived allele frequencies and compared observed frequencies in healthy versus disease samples to expected population frequencies, testing for systematic deviations that might indicate selection effects using the ancestral allele annotations.
Isoform usage. To identify cell-type-specific isoform usage, we analysed the Tabula Muris dataset which provides full-length transcript coverage suitable for exon-level quantification. We used mouse genome annotations (GRCm39.113) and queried individual genes against sample-specific Malva indices with standard coverage analysis parameters. For each gene, we merged overlapping annotated exons to create consensus gene models, then quantified average coverage per exon across cell types.
We implemented a nested marker analysis approach: first identifying marker genes using one-versus-all differential expression testing with the Wilcoxon rank-sum test and Benjamin-Hochberg multiple testing correction (log2 fold change ≥1.0, adjusted P value ≤ 0.05). For genes identified as cell-type markers, we performed exon-level differential analysis within marker cell types to identify marker exons: exonic regions showing cell-type-specific expression patterns within broadly expressed genes. This approach enabled detection of exon specificity in specific cell types despite the host gene being a marker gene shared by more cell types.
Additionally, we analysed 3′ UTR length regulation using the MOSTA Stereo-seq mouse embryonic development atlas spanning E9.5–E15.5. For validation, we aligned the same sequencing reads using STAR (v2.7.11b) with default parameters to generate coverage tracks for comparison with Malva results. We performed standard Malva coverage-like analysis targeting the Add2 locus, focusing on proximal and distal polyadenylation sites previously identified in bulk and single-cell RNA-seq studies. We quantified proximal versus distal 3′ UTR usage by computing coverage ratios in defined UTR regions, then mapped these expression patterns spatially to identify tissue-specific UTR isoform preferences during embryonic development.
Detection of circRNAs. To interrogate the expression of the circRNA CDR1as across Malva Index, we designed a 36-nucleotide probe centred on its backsplice junction. Therefore, the probe sequence spans 18 nucleotides upstream of the splice donor site and 18 nucleotides downstream of the splice acceptor site, capturing the unique junction sequence that distinguishes circular from linear transcripts. We used w = 24, τ = 0.65 for querying Malva Index.
Benchmarking polyadenylation site detection against polyASite
To evaluate Malva’s ability to detect alternative polyadenylation events, we leveraged polyASite v3.051, a database of polyadenylation sites identified from a large set of samples from the Human Cell Atlas (also ingested in Malva Index) using 3′ end sequencing protocols. For each annotated polyA site, we designed two probe types: (1) polyA probes consisting of 44 bp of upstream genomic sequence followed by a 20-bp polyA tract (20*A); and (2) control probes consisting of 64 bp of genomic sequence around the same position, but without the polyA signal. We queried both probe sets against the same HCA samples used to build polyASite and computed Spearman correlations between Malva pseudocounts and polyASite usage scores within each tissue type. Correlations were computed per-probe per-tissue rather than globally, as pseudocounts were not depth-normalized; this approach assesses the concordance of relative usage patterns rather than absolute quantification. Probe sequences are publicly deposited (Data availability).
Large-scale somatic mutation detection and benchmark against scTML
To systematically benchmark Malva’s mutation detection capabilities at scale, we utilized the scTML database53, which provides uniformly processed single-cell RNA-seq data from 280 tumour samples across 16 cancer types with matched variant calls. The scTML pipeline utilized GATK HaplotypeCaller for variant detection from aligned reads, with subsequent filtering for quality and read support. We extracted SNVs located in exonic regions or UTRs (excluding intronic variants due to lower sequence complexity and repeat content) and constructed 45-bp probes centred on each variant position. For each probe, we queried the corresponding sample’s Malva index and classified cells as variant-positive based on k-mer matches (w = 24, τ = 1.0). Sensitivity was computed as the fraction of scTML-positive cells detected by Malva; specificity was computed from cells in matched normal samples or variant-negative tumour cells.
Reference-free analysis using k-mer composition
Traditional single-cell analysis relies on mapping reads to reference genomes and counting annotated genes. However, this approach cannot capture the full diversity of RNA sequences, particularly in non-model organisms or when studying unannotated transcripts. We developed a reference-free analysis pipeline that clusters cells based on their complete k-mer repertoire, revealing relationships invisible to gene-based methods.
Bucketing approach for scalable k-mer analysis
Direct analysis of k-mer composition faces a fundamental challenge: even modest datasets contain billions of unique k-mers, making cell-by-k-mer matrices computationally intractable. To address this, we implemented a bucketing strategy that groups similar k-mers while preserving sequence relationships.
The bucketing algorithm uses a MinHash-based approach to assign k-mers to a fixed number of buckets based on their w-mer composition, where w < k. For each k-mer, we extract all possible contiguous w-mers (typically w = 16 for k = 24) and compute two independent hash functions (MurmurHash3 and xxHash64) for each w-mer. We retain the minimum hash value from each function across all w-mers in the k-mer, then combine these minima into a composite signature. The final bucket assignment is determined by taking the modulo of this signature with the predefined number of buckets (default 100,000).
This approach promotes that k-mers with similar w-mer composition are assigned to the same or nearby buckets. The resulting cell-by-bucket matrix reduces dimensionality from billions of unique k-mers to, for example, 100,000 buckets while preserving sequence relationships. Importantly, bucket assignments are deterministic and consistent across datasets, enabling cross-dataset and cross-species comparisons. We process k-mers in chunks and accumulate bucket counts per cell using sparse matrix operations, allowing analysis of datasets with hundreds of millions of cells.
Local structure preservation analysis
To validate that k-mer bucket representations preserve biologically meaningful cellular relationships, we compared local neighbourhood structure between sequence-based and gene count PCA embeddings using highly variable features. For each cell in the overlapping dataset, we identified k-nearest neighbours in both representations (k = 15). We then computed Wasserstein distances between: (1) distances from each cell to its k-nearest neighbours in sequence space; and (2) distances from that cell (in sequence space) to neighbours identified in gene count space. The resulting distribution was compared against a random null model using ROC-AUC analysis, yielding Local Structure Agreement scores where values ≫0.5 indicate better-than-random preservation of local cellular relationships.
Cell clustering and marker sequence discovery
Using the cell-by-bucket matrix, we follow a standard single-cell analysis workflow implemented in scanpy. We normalize bucket counts to account for sequencing depth differences, then select highly variable buckets based on their dispersion relative to mean expression. After dimensionality reduction with PCA (retaining 30 components), we construct a nearest neighbour graph and apply the Leiden algorithm via leidenalg v0.10.2 to identify cell clusters with similar k-mer profiles. Clustering similarity between k-mer profiles and gene count inputs were quantified using the Normalized Mutual Information metric:
$$\mathrmFor more tech updates, stay tuned to our blog.(Keep following us for the latest insights._{1},{Y}_{2})=\frac{2\times I({Y}_{1};{Y}_{2})}{[H({Y}_{1})+H({Y}_{2})]}$$
where Y1 and Y2 are two clusterings to be compared, H is the entropy function and I(Y1; Y2) = H(Y1) − H(Y1|Y2) is the mutual information function.
To understand the biological basis of these clusters, we identify differentially abundant buckets between groups using a t-test with Benjamini–Hochberg correction (selecting features with adjusted P value < 0.05 and log2 fold change > 1). We then retrieve the k-mers assigned to these differential buckets and perform targeted de novo assembly using SPAdes v4.2.0 in RNA mode74.
To determine genomic origin and interpretability, contigs were annotated in two passes. First, contigs were aligned to the appropriate host references using minimap2 (v2.1.1-r341) with spliced presets for genome mapping and ungapped mapping to transcriptomes, against GRCh38. For transcript-level alignment we mapped to Ensembl cDNA/lncRNA catalogues, for alignments with high mapping quality. Based on these, contigs were classified as: (1) genic if overlapping annotated transcripts; (2) intergenic if mapping uniquely outside annotated features; or (3) unmapped if no confident hit was found. For loci with multiple contigs, we compared per-cell Malva coverage tracks across the locus to distinguish isoform-specific versus locus-wide signal. Second, contigs without confident host assignment (or with rRNA signatures) were analysed using Kraken2 (v2.1.5) with a standard RefSeq PlusPF database (bacteria, archaea, viral, human, UniVec/adapter sequences). We recomputed the expression using the annotated and unannotated assembled contigs, and compared cell-wise totals and feature-wise abundances.
We also evaluated Malva in a setting with limited genomic reference resources, by processing publicly available Placozoa single-cell RNA-seq data75 (SRA project PRJNA982113). Reads were indexed with the same k-mer configuration used elsewhere (k = 24) and embedded using our sequence-bucket approach. Dimensionality reduction and clustering followed the standard scanpy single-cell analysis workflow outlined above.
Reporting summary
Further information on research design is available in the Nature Portfolio Reporting Summary linked to this article.
{For more tech updates, stay tuned to our blog.|Keep following us for the latest insights.|Check back often for more exciting news!}