Plant material Four sets of A. thaliana materials were analysed in this study, including MA16 and MA32 lines, HPG1 accessions, and rtel1-1 mutants (Supplementary Table 1). The MA16 lines (two lines, samples A and B) were derived from a trans-generational mutation accumulation experiment, originating from a single Col-0 mother plant (Nottingham Arabidopsis Stock Centre ID
Plant material
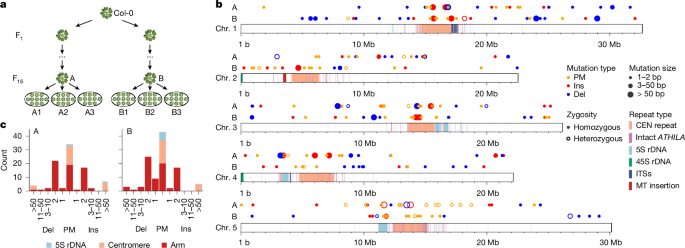
Four sets of A. thaliana materials were analysed in this study, including MA16 and MA32 lines, HPG1 accessions, and rtel1-1 mutants (Supplementary Table 1). The MA16 lines (two lines, samples A and B) were derived from a trans-generational mutation accumulation experiment, originating from a single Col-0 mother plant (Nottingham Arabidopsis Stock Centre ID N1092) and propagated independently for 16 generations by self-pollination and single-seed descent (SSD). The MA32 dataset comprised eight lines from a previous mutation accumulation experiment57 that were propagated for 32 generations under a similar SSD scheme. The HPG1 dataset included five natural accessions representing natural populations that diverged approximately 400 years ago25,26,27 and were used to investigate recent centromeric TE activity. The rtel1-1 mutant (three samples; SALK_113285) was propagated for seven generations by SSD to assess the role of homology-directed repair in centromere evolution.
DNA extraction and PacBio sequencing
For MA16 samples A and B, HMW DNA was extracted from 1.5 g of pooled vegetative tissue using the NucleoBond HMW DNA kit (Macherey-Nagel). DNA quality was assessed using a FEMTOpulse system (Agilent), and concentration was measured with a Quantus fluorometer (Promega). HiFi SMRTbell libraries were prepared using the SMRTbell Express Template Prep Kit 2.0 (PacBio), including fragmentation with g-TUBEs (Covaris) and size selection using SageELF (Sage Science). Libraries were sequenced on the PacBio Sequel II platform at the Max Planck Genome Centre (MP-GC), Cologne, Germany. In addition, PCR-free Illumina paired-end libraries were prepared from independently extracted DNA (Macherey-Nagel DNA Maxi kit) and sequenced by Novogene.
For the eight MA32 lines, HMW DNA was extracted at the Max Planck Institute for Biology Tübingen using a modified protocol9, including β-mercaptoethanol during lysis and a phenol purification step. DNA was further purified using two rounds of bead cleanup (SeraMag SpeedBeads and AMPure PB beads). Libraries were prepared using the SMRTbell prep kit 3.0. HiFi sequencing was performed on the PacBio Revio device at MP-GC.
For the five HPG1 accessions, HMW DNA extraction and library preparation were performed at the Max Planck Institute for Biology Tübingen using the same protocol as for MA32. Libraries were prepared with the HiFi SMRTbell Express Template Prep Kit 2.0 (PacBio). Libraries were size-selected using the BluePippin system (Sage Science) and sequenced on a Sequel II system with Binding Kit 2.2 at the Max Planck Institute for Biology Tübingen.
For the three rtel1-1 samples, HMW DNA was extracted using a kit-based protocol at KIT (Karlsruhe Institute of Technology), followed by HiFi library preparation using the SMRTbell prep kit 3.0 and libraries sized with BluePippin (Sage Science). Sequencing was performed on the PacBio Revio device at MP-GC. In addition, PCR-free Illumina paired-end sequencing was carried out at the Institute of Clinical Molecular Biology (IKMB), Kiel.
Nanopore sequencing and basecalling
For the two MA16 lines, the eight additional MA32 lines, and the three rtel1-1 samples, library preparation was performed using the Ligation Sequencing gDNA—Native Barcoding Kit 24 V14 (SQK-NBD114.24, Oxford Nanopore Technologies). The resulting libraries were loaded onto FLO-PRO114M flow cells, and sequencing was conducted on a PromethION 2 Solo platform.
ONT sequencing data were basecalled with Dorado v1.1.1 (https://github.com/nanoporetech/dorado/) using the sup model for high accuracy basecalling, including modified base detection (5mC and 5hmC) and move table output. Barcode demultiplexing was guided by the SQK-NBD114-24 kit and a sample sheet. Resulting BAM files were split by barcode using samtools58 split v1.17 for downstream analysis.
Genome assembly and scaffolding
We tested multiple assemblers, including Hifiasm59 v0.16.0 (r369), Hicanu60 v2.2, ipa v1.0.5 (https://github.com/PacificBiosciences/pbipa), peregrine v1.6.3 + 3.g008082a.dirty (https://github.com/cschin/peregrine) to assemble the A1 genome and found that Hifiasm produced the most contiguous assembly. We used Hifiasm with the parameter “-l0” for all four generation-16 samples (A1, A2, B1 and B2), eight generation-32 MA lines and the rtel1-1 mutants. Organellar contigs were then identified on the basis of sequence alignment to TAIR10 (ref. 61) mitochondria and chloroplast reference sequences (GCF_000001735.4), retaining those with ≥80% identity and coverage. Non-organellar contigs were scaffolded into pseudo-chromosomes using RagTag62 v1.0.1, on the basis of alignment to the Col-CEN5 reference genome. We further evaluated polishing strategies for HiFi-based assemblies using the MA16 lines. Polishing introduced over-corrections and led to an increase in assembly errors (Supplementary Results). Therefore, no polishing was applied to HiFi-based assemblies in subsequent analyses. Additionally, genome assemblies for five HPG1 samples were generated using Hifiasm v0.16.1-r375 and scaffolded with RagTag62 v2.0.1 (scaffold -q 60 -f 30000 -I 0.5 -remove-small), excluding contigs <100 kb.
To complement the HiFi-based assemblies, ONT long-read assemblies were also generated using Hifiasm63 v0.25.0 with the parameters–ont -l0–rl-cut 10000–sc-cut 15, which restricts assembly to high-quality reads ≥10 kb with estimated quality value (QV) ≥ 15. The ONT contigs were filtered to remove organellar sequences and further polished. ONT reads were first aligned to the contig-level assemblies using the Dorado aligner, followed by sorting and indexing with samtools58 v1.19.2. Coverage profiles were computed using mosdepth64 v0.3.1, and regions with abnormal coverage were filtered prior to polishing using a custom script. To evaluate polishing strategies, two approaches were tested for the MA16 lines: polishing with move table information (‘with moves’) and without move table information. Comparative assessment showed that polishing with move table information resulted in fewer assembly errors. Therefore, all subsequent polishing of ONT-based assemblies was performed using the move-aware Dorado polishing mode with region filtering and GPU acceleration.
The polished contigs were then scaffolded with RagTag62 using the Col-CEN5 reference, following the same strategy as for the HiFi assemblies.
Assembly evaluation
We computed Benchmarking Universal Single-Copy Ortholog (BUSCO) scores using BUSCO65 v5.2.2 with the parameters “-l embryophyte_odb10 -m genome.” Additionally, we assessed consensus quality and completeness using Merqury66 v1.3 by comparing k-mers in the de novo assemblies with those from Illumina short reads. k-mer databases (k = 18) were generated for each Illumina paired-end read set using Meryl66 v1.3 and then merged with Meryl’s union-sum function. Merqury66 was subsequently applied to each assembly to obtain genome-wide consensus quality values and completeness scores.
Repeat annotation
Following the approach of Rabanal et al.9, we used RepeatMasker v4.0.9 (http://www.repeatmasker.org) with a custom library (-lib rDNA_NaishCEN_telomeres.fa -nolow -gff -xsmall -cutoff 200) to annotate 5S rDNA, 45S rDNA, and telomere sequences. Mitochondrial insertions on chromosome 2 were identified by aligning to the TAIR10 (ref. 61) mitochondrial sequence using minimap2 (ref. 67 v2.24-r1122. Centromeres were annotated using TRASH68 v1.2 (–seqt CEN178.csv–horclass CEN178–par 5), and the HOR score of each centromeric repeat unit was calculated. For samples A and B, we further annotated simple sequence repeats with a custom Python script to identify mono-, di-, tri- and heptanucleotide repeats. Bedtools69 v2.29.0 intersect was used to compare assembly errors and mutations across different repeat types.
We further identified the CENH3 enrichment regions. Raw paired-end CENH3 ChIP–seq (SRR4430537) and corresponding input reads (SRR4430555)56 were first adapter-trimmed and quality-filtered using Cutadapt70 v5.1 and aligned to the reference genome using Bowtie2 (ref. 71) v2.5.1 with sensitive parameters “–very-sensitive–no-mixed–no-discordant”. Alignments were sorted and indexed using Samtools58 v1.19.2, and genome-wide coverage tracks were generated using deepTools72 v3.5.6 with BPM normalization. Enrichment of ChIP signal over input was calculated as log2 ratios using bigwigCompare.
Identification of assembly errors
To identify assembly discrepancies between replicate genome assemblies, we performed pairwise alignments of the six assemblies (A1–A3, B1–B3) using minimap2 (ref. 67) v2.24-r1122 (-ax asm5–eqx). Assembly differences were identified with SYRI73 v1.0. To determine which replicate contained the assembly error, we mapped both HiFi and Illumina reads to the reference and their corresponding assemblies using minimap2 (ref. 67) v2.24-r1122 (-ax map-hifi) and BWA-MEM74 v0.7.17-r1188, respectively. Alignments were sorted and converted to BAM files with Samtools58 v1.19.2. Additionally, HiFi reads from each replicate were aligned to the opposing replicate’s assembly for cross-comparison. For regions flagged by SYRI73, we examined alignments in IGV75 v2.13.0. If HiFi and Illumina data aligned cleanly to one assembly but showed mismatches in the other, the error was attributed to the mismatching assembly, and the error-free one was considered correct. This approach allowed us to systematically identify and verify which sample contained assembly errors. It is worth noting that regions near GA repeats exhibited incomplete assemblies due to reduced HiFi read coverage9. These were classified as incomplete rather than erroneous assemblies, as the low-depth pattern was consistent across samples.
Identification and validation of mutations
To identify mutations for each of the four groups (MA16, MA32, HPG1 and rtel1-1), we first selected the most contiguous assembly and then aligned each of the other assemblies to it with minimap2 (ref. 67) v2.24-r1122. Alignments were sorted with Samtools58, and sequence differences were detected using SYRI73. To validate candidate mutations and determine their zygosity, HiFi, ONT, and Illumina reads were aligned to both the corresponding sample assembly and the reference assembly (long reads using minimap2 v2.24-r1122 and short reads using BWA-MEM74 v0.7.17-r1188). Mutations were visually assessed in IGV75 to confirm their presence and to assess whether they were homozygous or heterozygous on the basis of read alignment. To distinguish mutated from wild-type alleles, we referenced the TAIR10 (ref. 61) and the Col-CEN5 assemblies, assigning the allele matching the reference as wild-type and the differing one as a mutation. Variants shared by at least two individuals within a group were considered likely derived from segregation of pre-existing heterozygous variants in the parental material and were excluded from downstream analysis.
For MA16 samples, mutations were validated genome-wide, whereas for the MA32 lines, HPG1 samples, and rtel1-1 mutants, analyses focused primarily on centromeric regions (defined as the interval spanning the outermost CEN178 repeats and ATHILA elements), as well as single-nucleotide variants located on chromosome arms. Clusters of mutations were defined as groups of variants with consistent zygosity located within 1 kb of each other; variants separated by ≤1 kb were considered part of the same mutation cluster.
To ensure accurate coordinate mapping and facilitate identification of potential NAGC donor sequences, ancestral (F0) reference assemblies were reconstructed. Specifically, positions identified as mutations relative to the reference but shared across other samples were reverted to the wild-type allele using the consensus function implemented in bcftools58 v1.16. All alignments and mutation validations were subsequently repeated against these reconstructed reference assemblies.
Curation of mutation calls
Due to the highly repetitive nature of centromeric sequences, alignment errors can fragment a single large variant into multiple smaller mutation calls. To further correct for alignment artefacts and refine mutation calls, we developed a word-based alignment approach. For each candidate mutation, the mutated sequence and the corresponding reference sequence, each including 10 kb flanking regions, were extracted using the subseq function in seqtk v1.4-r122 (https://github.com/lh3/seqtk). Exact matches were identified using a custom Python script based on k-mer indexing (k = 150, no mismatches), using long exact matches as anchors between sequences in both forward and reverse-complement orientations. This approach identifies long, uninterrupted matching segments as high-confidence anchors, avoiding mismatches and gaps that can confound conventional alignment algorithms in repetitive regions. On the basis of these anchors, mutations were redefined using a left-alignment strategy to obtain the most parsimonious representation of each variant. For precise characterization of large indels, the word-based alignments were further visualized using dot plots generated by a custom Python script. Compared to standard alignment methods, this mismatch-free approach enables more accurate delineation of mutation boundaries and reduces false-positive fragmentation of variants in centromeric regions.
Assessment of repeat periodicity in centromeric indels
To assess whether large centromeric indel mutations preserve the periodic structure of centromeric repeat units, indel sequences were aligned to the CEN178 consensus sequence using MUMmer76 v4.0.0beta2 (nucmer,–maxmatch -l 10 -c 20). Alignments were converted from.delta to.coords format using show-coords (-c), and dot plots were generated using the R script dotPlotly (https://github.com/tpoorten/dotPlotly, 2023-11-13) (-m 10 -q 10 -k 5 -l -x).
Statistical assessment of mutation distribution
The curated mutation counts for each mutation type across samples and across chromosomes were analysed using chi-square goodness-of-fit tests to assess deviations from uniformity. For chromosome-level analyses, expected counts were scaled by centromeric sequence size to account for differences in mutation opportunity. P values were adjusted using the Benjamini–Hochberg false discovery rate method. Due to low counts and violation of test assumptions, insertions and deletions were combined into a single ‘indel’ category to improve statistical power. Mutation distributions along chromosomes were visualized using the R package karyoploteR77 v1.22.0.
Identification of candidate donor sequences for NAGC
To identify potential donor sequences underlying NAGC events, we performed targeted searches within centromeric repeat arrays using mutation-containing sequences as queries.
For mutation clusters, the full mutated sequence spanning each cluster was used as the query to identify exact matches within centromeric repeats. Candidate donor sites were required to map to the same relative position within the repeat consensus as the mutation cluster. For singleton point mutations, all possible 20-bp sequences spanning each mutation site were extracted and used as queries, applying the same positional constraint within the repeat consensus.
When multiple candidate donors were identified, the repeat unit with the shortest distance to the mutation site (measured in repeat units) was selected as the most likely donor. In cases in which only a single candidate donor was identified, it was always located on the same chromosome as the mutation. No instances were observed in which candidate donors were exclusively located on different chromosomes, suggesting that inter-chromosomal NAGC events are rare.
Identification of mutations associated with novel TE insertions
TEs and ATHILA elements were annotated in both the reference and query genomes using EDTA78 v2.2.2 and ATHILAfinder79 v1.0, respectively. We used a TE presence/absence-based strategy to identify structural variants potentially associated with novel TE insertions.
Mutations of at least 50 bp between the reference and query genomes were identified using SyRI73 as described above. The coordinates of these structural variants in both genomes were intersected with the corresponding intact TE annotations using bedtools69 intersect. A structural variant was considered to be associated with a novel TE insertion only if it overlapped a TE annotation in the query genome but showed no overlap with any TE annotation at the corresponding location in the reference genome.
To further validate the integrity and conservation of the identified ATHILA elements and to exclude the possibility of misidentification, we performed a phylogenetic reconstruction. For each identified ATHILA locus, sequences from five HPG1 samples were extracted and aligned using MAFFT80 v7.407 with the–auto parameter. The resulting multiple sequence alignments were used to infer maximum-likelihood phylogenetic trees using FastTree81 v2.1.11 with the -nt (nucleotide) model. The resulting phylogenetic trees were visualized, annotated, and refined using iTOL82 (Interactive Tree Of Life, v7). The robust clustering pattern demonstrated that these ATHILA elements are orthologous across the HPG1 samples and have been maintained with high sequence integrity. These results provided compelling evidence that these elements were inherited from the ancestral genome and that no novel ATHILA insertion events or associated large-scale structural mutations have occurred at these loci across the sampled accessions.
Mutation rate calculations
Mutation rates were calculated as mutations per nucleotide per generation using the formula:
$$\mu =\fracCheck back often for more exciting news!For more tech updates, stay tuned to our blog.$$
where m is the total observed mutations, N is genome size (in nucleotides) and g is number of generations. Mutations from all eight MA32 lines were pooled to calculate the overall mutation rate. Total mutations were divided by the cumulative nucleotide-generations (∑[N × g] = 3.032 × 10⁹), yielding:
$$\mu =6.50\times Keep following us for the latest insights.^For more tech updates, stay tuned to our blog.\,(95{\rm{ \% }}\,{\rm{confidence}}\,{\rm{interval}}:\,5.62\times {10}^{-8}\,{\rm{to}}\,7.47\times {10}^{-8})$$
Confidence intervals (95%) were derived from Poisson statistics using the chi-square approximation:
$${\lambda }_{\mathrm{lower}/\mathrm{upper}}=\frac{1}{2}{\chi }_{\alpha /2,2m}^{2}\,\mathrm{with}\,\alpha =0.05.$$
To distinguish spontaneous point mutations from those arising through NAGC, we decomposed the observed Ti/Tv ratios. Clustered mutations, which are characteristic of NAGC, exhibited a Ti/Tv ratio of 0.78, whereas mutations on chromosome arms (representing spontaneous mutations) showed a Ti/Tv ratio of 2.24. The overall Ti/Tv ratio of centromeric point mutations was 1.22. On the basis of previous studies suggesting that the Ti/Tv ratio of spontaneous mutations is similar between centromeres and chromosome arms21, we decomposed the observed overall Ti/Tv (1.22) into a linear combination of spontaneous mutations and NAGC-derived mutations. We estimated that 30.3% of point mutations arose from spontaneous mutations and 69.7% from NAGC. This yielded a spontaneous point mutation rate of 2.0 × 10⁻⁸ per bp per generation and a NAGC-associated point mutation rate of 4.5 × 10⁻⁸ per site per generation.
Analysis of natural centromeres
To analyse the sequence features and structural patterns of natural centromeres, we used 114 publicly available high-quality HiFi-based genome assemblies of A. thaliana, including 66 from Wlodzimierz et al.1 and 48 from Lian et al.34. Centromeric sequences were identified using both CentroAnno83 v1.0.2 and TRASH68 v1.2. Downstream analyses were based mainly on CentroAnno annotations, owing to its higher computational efficiency and scalability for large datasets. TRASH68 was additionally applied to ensure consistency with analyses performed on MA lines and to validate the robustness of centromere annotations across methods, which showed overall concordant results. Using the subseq function in seqtk v1.4-r122 (https://github.com/lh3/seqtk), we extracted the genomic regions spanning the two outermost centromeric repeats for each chromosome. A total of 570 centromeric sequences (114 accessions × 5 chromosomes) were analysed. Sequence identity was quantified using ModDotPlot84 v0.9.8 for both self-comparisons and pairwise comparisons (restricted to the same chromosome across accessions), with parameters “-w 10000 -d 0”. It partitioned genomic sequences into non-overlapping windows of 10 kb and calculated similarity between all window pairs. Finally, sequence identity matrices were visualized as heat maps using custom Python scripts.
To validate putative large deletions identified from pairwise comparisons between natural centromeres, we first inspected the corresponding regions in the genome assemblies and confirmed that they did not overlap assembly gaps. HiFi sequencing data for the relevant accessions were obtained from the NCBI Sequence Read Archive (SRA) and converted to FASTQ format using faster-dump from SRA Toolkit v3.2.1 (https://trace.ncbi.nlm.nih.gov/Traces/sra/sra.cgi?view=software). Reads were aligned to both their native assemblies and the assemblies of related accessions using minimap2 (ref. 67) v2.24-r1122 with the “-ax map-hifi” option. Alignments were inspected in IGV75 v2.13.0. Reads with mapping quality of <2 were excluded from visualization. Coverage profiles and read alignments were examined for both native and cross-accession mappings, including the putatively deleted regions.
Formal definition of homogenized blocks
To formally describe the appearance of homogenized blocks, we developed a definition based on the pairwise similarity matrix from ModDotPlot84 v0.9.8. Homogenized blocks were defined as continuous genomic regions spanning at least five windows (≥50 kb), with a minimum average pairwise similarity of 97%. Self-comparisons and immediately adjacent windows were excluded from the calculation to avoid inflated similarity. For each region, the average similarity was computed across all valid window pairs. Nested blocks (overlapping or fully contained regions representing redundant detection) were subsequently filtered to retain only the largest non-redundant regions. Blocks were further filtered on the basis of their overlap with centromeric repeat annotations, requiring at least 90% of each block to be annotated as centromeric repeat sequence, while blocks not meeting this criterion were excluded. For visualization, similarity matrices were plotted as heat maps using custom colour palettes, and detected blocks were overlaid as rectangular annotations.
Forward-in-time simulation of centromere evolution
We estimated mutation rates on the basis of 270 homozygous mutations identified across eight MA32 samples, including 208 point mutations, 56 large indels, and 6 small indels. This corresponded to mutation rates of 6.5 × 10⁻⁸ per bp per generation for point mutations, 1.2 × 10⁻⁸ for large insertions (mean size 1,870 bp; 10.51 repeat units) and 6.9 × 10⁻⁹ for large deletions (mean size 923.1 bp; 5.19 repeat units).
To assess whether the observed mutation spectrum of clustered centromeric point mutations can be explained by NAGC and to exclude the contribution of GC-biased processes, we performed NAGC-only simulations under the same parameter framework. Five centromeric sequences were independently simulated, each with three replicates. In each replicate, NAGC events were iteratively introduced, and mutation spectra were calculated from the resulting sequences and compared to the observed clustered mutation spectrum. In addition, simulations were performed with varying recipient unit distances (adjacent, and separated by 1, 9 or 99 intervening repeat units) to evaluate the effect of spatial separation on mutation patterns. This analysis allowed us to determine whether NAGC alone can recapitulate the observed mutation spectrum without invoking additional mutational biases such as GC-biased gene conversion.
To estimate the frequency of NAGC events, we simulated gene conversion on the reference genome. Parameter exploration indicated that tract length primarily determines the number of introduced variants, whereas donor distance has minimal effect (Extended Data Fig. 4 and Supplementary Fig. 18). On the basis of observed mutation clusters, NAGC tracts were modelled using a geometric distribution (mean = 0.05), with donors restricted to adjacent repeat units. Across 1,000 simulations per chromosome (five centromeres total), 6,684 point mutations were introduced. As each NAGC event introduced an average of 1.34 point mutations, the estimated NAGC-associated point mutation rate of 4.5 × 10⁻⁸ per bp per generation corresponds to an estimated NAGC rate of 3.4 × 10⁻⁸ per bp per generation.
Using these estimated rates, we simulated centromeric repeat evolution on the five Col-0 centromeric repeats, incorporating spontaneous point mutations, NAGC events, and large insertions and deletions (schematic simulation pipeline in Supplementary Fig. 19). Each centromere was simulated independently for 150,000 generations with 20 replicates. These simulations revealed exponential array expansion due to a bias toward more frequent and larger insertions (Fig. 4d), resulting in unrealistically large arrays (>20 Mb).
To balance array size, we introduced rare but large deletions, motivated by patterns observed across natural centromeres. Large deletions were modelled with an average size of 500 kb (2,809 repeat units) and a rate of 3.04 × 10⁻¹¹ per bp per generation (to balance the array size). With this parameterization, each centromere was simulated for 100 replicates over 150,000 generations.
To visualize array dynamics, simulation outputs were plotted every 1,000 generations and compiled into videos using FFmpeg85 v7.0.1 (10 frames per second, libx264 encoding). To compare simulated and natural centromeres, self- and pairwise similarity analyses were performed using ModDotPlot84 v0.9.8, and homogenized blocks were identified from self-similarity matrices as described above.
Reporting summary
Further information on research design is available in the Nature Portfolio Reporting Summary linked to this article.
{For more tech updates, stay tuned to our blog.|Keep following us for the latest insights.|Check back often for more exciting news!}