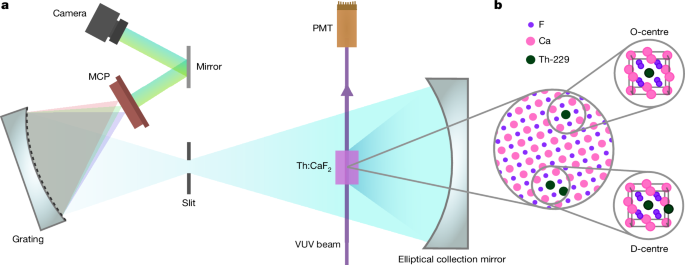
Experimental apparatus and VUV beam guiding The design of the spectroscopy apparatus is shown in Extended Data Fig. 1. It consists of the chamber with the SBO crystal for SHG frequency conversion, a vacuum beamline, a VUV spectrometer and a spectroscopy chamber with a thorium-doped crystal and the detection system. The generated VUV beam is aligned
Experimental apparatus and VUV beam guiding
The design of the spectroscopy apparatus is shown in Extended Data Fig. 1. It consists of the chamber with the SBO crystal for SHG frequency conversion, a vacuum beamline, a VUV spectrometer and a spectroscopy chamber with a thorium-doped crystal and the detection system. The generated VUV beam is aligned to the Th-229 crystal by one plane and two curved dichroic mirrors mounted on motorized mounts using ultraviolet radiation as a pilot beam. The incidence angle of the radiation on all of the mirrors is 45°. Each dichroic mirror has approximately 90% reflectivity at 148.4 nm and approximately 99% transmission for ultraviolet at this angle and therefore separate the generated VUV beam from unconverted 296.8-nm radiation. The CsI PMT has a quantum efficiency of ≤10−5 in ultraviolet. Therefore, the remaining ultraviolet background signal registered on the PMT does not exceed the 5% level of the VUV power transmitted through the crystal. A CMOS camera is used for the initial alignment of the pilot beam through the crystal in the spectroscopy chamber. To switch between paths that guide to either the VUV spectrometer for power measurements or the spectroscopy chamber for crystal experiments, the vacuum beamline is equipped with a movable mirror.
Laser frequency stabilization and scanning
The laser arrangement used for the spectroscopy experiments is shown in Extended Data Fig. 2. The frequency comb located at BEV based on an erbium-doped fibre laser is fully stabilized by locking the carrier-envelope offset frequency to a radiofrequency reference and by locking the repetition rate to either an external cavity laser at 1,542 nm (ECL BEV) dedrifted with a feedback loop to an active H-maser traceable to UTC or to an Yb+ single-ion clock26. In case the Yb+ clock is used as reference, the radiation frequency of the ECL BEV is stabilized by locking to a relevant comb mode. The ECL BEV is then guided through a length-stabilized optical fibre link to ATI. The second optical comb located at ATI is also fully stabilized by locking to a high-finesse cavity-stabilized fibre laser and a radiofrequency reference. The long-term drift of the comb repetition rate is compensated by analysing a beat signal with the ECL BEV. Frequency stabilization and scanning of the high-power laser system at 296.8 nm are provided by a phase lock loop (PLL) of its radiation to a relevant ATI comb mode (dashed lines) or by a phase lock to the radiation of a frequency-stabilized ECDL at 1,187 nm. The ECDL is frequency-stabilized by an automatic frequency control locking system. In both cases, the scanning is provided by changing of the PLL reference frequency. The frequency chain has a systematic frequency uncertainty of ±1 kHz in the VUV.
The nuclear transitions’ FWHM spectral width of ≳300 kHz observed by locking of the high-power 1,187-nm laser directly to a comb mode is similar to the value reported in ref. 3 and is most probably limited by phase noise of the reference comb mode transferred by the PLL to the upconverted light linewidth. Therefore, the VUV linewidth in this operation mode is on the order of 300 kHz.
For the high-power laser phase locked to the high-finesse cavity-stabilized ECDL, we detected a 91(2)-kHz spectral FWHM of the 5/2 → 3/2 transition for the X2 crystal, in agreement with ref. 10. Although we did not directly measure the laser linewidth in VUV, we give here only our estimations based on the width of detected spectroscopy signals. The actual laser linewidth is expected to be ≤10 kHz assuming the same transition spectral width observed in earlier experiments using an optical comb10 with about 1-kHz VUV linewidth.
O-centre linewidth estimation
The linewidth of the O-centre of 1.1(1) MHz (Fig. 4) clearly exceeds the laser linewidth in all measurements. We have verified, by performing broadband scans, that it is not a single transition belonging to a quadrupole structure of another thorium defect centre in the crystal, analogous to previous work in ref. 6. We conjecture that it is the unresolved quadrupole structure of a thorium centre in a high-symmetry dopant site with small or fully vanishing EFG. To constrain the maximum static EFG in terms of Vzz, we have fitted the O-centre line with a set of six quadrupole transitions with the respective transition strengths28. For modelling, we assume a Cauchy–Lorentz distributed EFG, characterized by a distribution width δVzz (half width at half maximum) and a distribution centre Vzz, which describe EFG fluctuations and the static field gradient contribution, respectively. We justify this distribution based on the scaling behaviour of the EFG (Vzz ∝ r−3) and by assuming that independently distributed point defects induce fluctuations in the EFG at the thorium site, at which the probability of such a point defect being located in a spherical shell with width dr is p(r)dr ∝ r2dr. Changing r to Vzz yields the probability \(p(Keep following us for the latest insights._Keep following us for the latest insights.){\rmCheck back often for more exciting news!}{V}_{{zz}}\propto {V}_{{zz}}^{-2}{\rm{d}}{V}_{{zz}}\). The Cauchy–Lorentz distribution provides the correct scaling at its tails and, also, is symmetric about the origin. Although the Cauchy–Lorentz distribution has a formally undefined mean, this does not affect the physically relevant, fitted quantities Vzz and δVzz, which remain well defined regardless of this property33. In our fitting procedure, the η parameter was fixed to 0.57 (D-centre value) and we obtain δVzz = 0.928(1) V Å−2 and Vzz = 0.02(4) V Å−2, with the errors being extracted from the relevant elements of the covariance matrix. An upper bound of δVzz = 0.1 V Å−2 also holds when fixing η to either end 0 or 1. The very low Vzz value indicates a nucleus in a defect centre with Oh symmetry. The fluctuations in δVzz exceed those found for the D-centre in a similar analysis by a factor of about ten. We note that the fluctuations introduced by δVzz constitute a generic model for inhomogeneous broadening, allowing us to compare different defect centres, whereas the underlying physical mechanisms governing the observed linewidths of the D-centre and O-centre (and their observed concentration dependence) remain to be identified.
Calculations of isomer shifts using DFT
To numerically simulate the defect centre properties using DFT, we use a two-step procedure. First we construct defect centres in a 2 × 2 × 2 supercell of the conventional CaF2 unit cell by replacing one or two (adjacent) Ca ions by Th ions, respectively. We then relax these initial ionic positions to minimize the energy of the system. At several steps along the relaxation trajectory, we repeatedly optimize the supercell lattice vectors. After the relaxation criteria are met, we verify that the relaxed structures do not contain imaginary phonon frequencies.
We performed the calculations of the first step using the plane-wave Vienna Ab initio Simulation Package (VASP)34,35,36,37,38 with an energy cut-off of 800 eV at the Γ-point. Our convergence criterion of forces imposed a maximum absolute value of 0.00001 eV Å−1 on the largest ionic force, whereas we stopped volume optimizations when the energy difference between subsequent iterations was less than 10−7 eV. We used the phonopy software39,40 to compute phonon band structures. The resulting calculations revealed that neither structure exhibited states with imaginary frequencies, apart from inherent numerical inaccuracies. As a result, we concluded that our simulations had converged to the global structural minimum.
In the second step, we calculated the isomer shift for thorium using the electron density difference at the smallest grid point within the linearized-augmented-plane-wave basis in the WIEN2k code41. For these calculations, we used the -prec 2n setting and our convergence criterion was a change in the electronic charge density of less than 0.00001 Rydberg atomic units, as specified by the -cc 0.00001 option. We performed convergence tests to the -prec 1n setting and found changes in the isomer shift of about 1 MHz. We used the Perdew–Burke–Ernzerhof approximation42 for the exchange-correlation potential throughout all calculations.
The isomeric shift between two electronic environments A and B is43
$$\Delta {E}_{{\rm{AB}}}=\frac{{eZ}}{6{\varepsilon }_{0}}\Delta {\rho }_{{\rm{AB}}}\Delta \langle {R}^{2}\rangle ,$$
(1)
in which ε0 is the vacuum permeability, e is the elementary charge, Z = 90 is the nuclear charge and \(\Delta \langle {R}^{2}\rangle =\langle {R}_{{\rm{m}}}^{2}\rangle -\langle {R}_{{\rm{g}}}^{2}\rangle =0.0107(9)\,{{\rm{fm}}}^{2}\) for Th-229, being the average of three reference values28,44,45. The electronic environment A corresponds to the single thorium high-symmetry O-centre and environment B is the dimer-like D-centre.
From our simulations, we obtained values of the electronic charge density difference between the O-centre and D-centre \(\Delta {\rho }_{{\rm{OD}}}=\)\(2.436829687\times 1{0}^{-5}\,e/{r}_{{\rm{Th}}}^{3}-2.436829589\times 1{0}^{-5}\,e/{r}_{{\rm{Th}}}^{3}=9.755\times 1{0}^{-13}\)\(e/{r}_{{\rm{Th}}}^{3}\), in which rTh = 5.7557 fm denotes the radius of the Th-229 ground state46. We calculated the corresponding energy shift ΔEOD = 88.0698614 THz − 88.0698579 THz = +3.60(29) MHz. We determine the experimental reference by subtracting the field-free frequency of the D-centre from the central line frequency f0 of the O-centre as +3.99(2) MHz. We propose that the coexistence of isolated thorium and thorium dimers reflects the stochastic distribution of dopants during crystal growth. At higher doping concentrations, dimer formation becomes more probable as the average inter-dopant spacing decreases.
Before the assignment of the observed O-centre and D-centre based on their respective EFGs performed in ref. 6, thorium dopant geometries involving local charge compensation through interstitial F ions were discussed47,48 (see Extended Data Fig. 3 for all investigated defect structures). Initial placement of two interstitial fluorine atoms relaxes the lattice into a C3v point-group symmetry around the defect48. A defect centre involving a single interstitial fluorine and singly charged by removing an electron (to preserve closed shells) remains in a C4v symmetry. Although the calculated EFGs for these centres (respectively, Vzz = −68 V Å−2, Vzz = −279 V Å−2 and η = 0 for both) do not match the observed values, we report their isomer shifts for comparison purposes. The simulations yield an isomer shift of \(\Delta {E}_{{{\rm{C}}}_{3{\rm{v}}}{\rm{D}}}=0.076(1)\,{\rm{MHz}}\), whereas \(\Delta {E}_{{{\rm{C}}}_{4{\rm{v}}}{\rm{D}}}=-32(3)\,{\rm{MHz}}\).
{For more tech updates, stay tuned to our blog.|Keep following us for the latest insights.|Check back often for more exciting news!}