Drosophila stocks and husbandry Stock flies and adult flies were reared on a standard yeast-based diet containing 4.5% cornmeal (Nippn Corporation), 6% brewer’s yeast (Asahi Breweries, HB-P02), 6% glucose (Nihon Shokuhin Kako) and 0.8% agar (Ina Food Industries, S-6) with 0.4% propionic acid (FUJIFILM Wako, 163-04726) and 0.15% butyl p-hydroxybenzoate (FUJIFILM Wako, 028-03685), unless otherwise
Drosophila stocks and husbandry
Stock flies and adult flies were reared on a standard yeast-based diet containing 4.5% cornmeal (Nippn Corporation), 6% brewer’s yeast (Asahi Breweries, HB-P02), 6% glucose (Nihon Shokuhin Kako) and 0.8% agar (Ina Food Industries, S-6) with 0.4% propionic acid (FUJIFILM Wako, 163-04726) and 0.15% butyl p-hydroxybenzoate (FUJIFILM Wako, 028-03685), unless otherwise stated. Flies were maintained at 25 °C. To allow synchronized development and constant density, embryos were collected using agar plates (3% agar, 1% sucrose and 0.3% acetic acid) with a live yeast paste and 10–15 μl of the embryos were spread onto bottles.
Fly lines used in this study were Canton-S, wCS (wiso31 backcrossed to Canton-S for eight generations), 4E-BPintron-dsRed (ref. 33), Cg-Gal4 (Bloomington Drosophila Stock Center (BDSC), 7011), tub-Gal80ts (BDSC, 7017), r4-Gal4 (BDSC, 33832), fit-Gal4 (ref. 30), WBFBGS (ref. 59), UAS-2×EGFP (BDSC, 6874), UAS-lacZ-RNAi (from R. Carthew), UAS-Lsp2-RNAi (National Institute of Genetics, 6806R-2), UAS-Lsp1α-RNAi (Vienna Drosophila Resource Center (VDRC), 14898), UAS-Fbp2-RNAi (VDRC, 33173), Lsp2-muGFP (this study) and pGnmtGS (this study). WBFBGS was used as the adult fat-body driver, whereas pGnmtGS was used as the larval fat-body driver. This selection was based on the observation that WBFBGS exhibits significant leakiness during the larval stage60, whereas pGnmtGS has weaker expression in the adult stage. Cg-Gal4, r4-Gal4, UAS-lacZ-RNAi, UAS-Lsp2-RNAi, pGnmtGS are backcrossed to wCS for eight generations.
To generate Lsp2-muGFP flies, the CRISPR–Cas9 system was used to insert muGFP at the C terminus of the Lsp2 gene61. The muGFP codons were optimized for expression in Drosophila melanogaster. These modifications and insertions into the EcoRI/XbaI site of the pUC57 vector were performed by GenScript. An sgRNA target site of Lsp2 was selected using CRISPR Optimal Target Finder62. Complementary oligonucleotides with overhangs were annealed and cloned into the BbsI-digested U6b vector using a DNA ligation kit (Takara, 6023).
Sense strand: 5′-TTCGGTCCAGGATCTAGACCACAT-3′
Antisense strand: 5′-AAACATGTGGTCTAGATCCTGGAC-3′
The targeting vector was constructed by inserting a linker sequence (GGTGGATCTGGAGGTTCCGGCGGCTCAGGGGGTAGT) and muGFP between 500-bp Lsp2 homology arms, incorporating a silent mutation in the PAM sequence adjacent to the sgRNA site (TGG to TTG). The linker sequence, muGFP and homology arms were PCR-amplified using Q5 High-Fidelity 2× Master Mix (New England BioLabs, M0492L). PCR primers were designed using the NEBuilder Assembly Tool. The gel-purified PCR products were cloned into the EcoRI-digested pBluescript II SK(+) vector using NEBuilder HiFi DNA Assembly Master Mix (New England BioLabs, E2621X). The mixture of pU6b-sgRNA and targeting vector was microinjected into w1118; attP40Check back often for more exciting news!/CyO embryos by WellGenetics. F0 adults were crossed with balancer lines, and lines with the correct muGFP insertion were identified by PCR amplification and sequencing of the target locus. The primers used for PCR are listed in Supplementary Table 6.
To generate pGnmtGS, a 500-bp fragment upstream of the start Gnmt codon and the GeneSwitch sequences were PCR-amplified using PrimeSTAR Max DNA Polymerase (Takara, R045A). PCR primers were designed using the NEBuilder Assembly Tool. The gel-purified PCR products were cloned into the KpnI-digested pElav-GeneSwitch vector using NEBuilder HiFi DNA Assembly Master Mix (NEB, E2621L). The resulting plasmid was injected into w1118 embryos (WellGenetics). F0 adults were crossed with balancer lines, and w+ lines were selected. PCR primer sequences are provided in Supplementary Table 6. Larval expression is restricted almost entirely to the fat body, although additional expression was observed in other tissues, such as small cells within the gut (possibly enteroendocrine cells).
Dietary manipulations
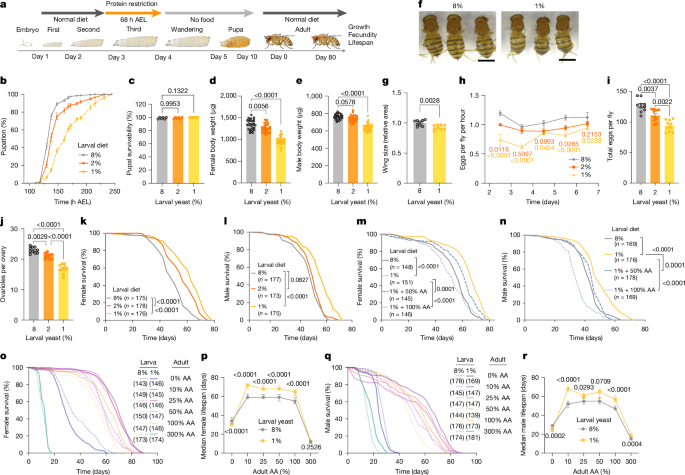
For larval yeast manipulation, diets containing 8%, 2% and 1% yeast were prepared using baker’s yeast (Lesaffre, Saf-Instant Red), 6% glucose (FUJIFILM Wako, 049-31165), 1% agar (FUJIFILM Wako, 010-15815), 0.3% propionic acid (FUJIFILM Wako, 163-04726) and 0.15% methyl p-hydroxybenzoate (FUJIFILM Wako, 132-02635). Cornmeal was omitted from these formulations to simplify food preparation, facilitate precise nutritional manipulation and avoid compositional variability arising from batch-to-batch differences in cornmeal. Increasing the yeast content to 8% (from the 6% used in the standard diet) resolved the slight developmental delay associated with the omission of cornmeal; consequently, the 8% yeast diet was used as the control (fully fed) condition. Embryos were collected within four hours of egg-laying in a cage (Flystuff, 59-101 or 59-100). The embryos (10–15 μl) were spread by micropipette onto a surface of 8% yeast diet and raised until the late-second-instar larval stage. At around 68 h AEL, the larvae were floated up using 30% glycerol and transferred to each diet. Normally, 150–200 adult flies were obtained per bottle. After eclosion, adult flies were collected to a standard yeast-based diet.
Chemically defined diet, specifically holidic medium24 or HolFast27, was used for amino acid manipulation. Amino acid concentrations of the holidic medium were optimized by exome matching25. For larval dietary manipulation using the holidic medium, the sugar source (glucose rather than sucrose) and the amount of agar and preservatives were modified according to a previous study when used for larval dietary manipulation32. Embryos were distributed by micropipette onto the surface of a standard yeast-based diet and reared until the late-second-instar larval stage. At approximately 68 h AEL, larvae were collected by flotation using 30% glycerol and transferred to either the holidic medium or the HolFast diet. After eclosion, adult flies were transferred back to a standard yeast-based diet. For adult dietary manipulation, ePR-flies were fed the holidic medium containing different amount of amino acid.
Analysis of developmental speed, eclosion rate and body weight
After ePR treatment, larvae were picked up and transferred onto bottles or vials and the pupal number was counted every several hours. The number of eclosed adult flies per pupal number was calculated as eclosion rate. For the body weight measurement, each single fly was anaesthetized by CO2 and placed onto a microbalance (METTLER TOLEDO, XPR2).
Lifespan analysis
Adult flies were allowed to mate in bottles for two days post-eclosion. Subsequently, 25 females or 30 males were allocated to each vial. The flies were maintained at 25 °C under 60% humidity and a 12 h light:12 h dark cycle. For time-restricted knockdown analysis with Gal80ts, flies were maintained at 18 °C or 29 °C. Flies were transferred to fresh vials two to three times per week, during which the number of dead or censored individuals was recorded. Survivability was calculated by OASIS2 (ref. 63) and the survival curve was replotted using GraphPad Prism 10 or 11. Survival analysis was performed by R using the survival package64. Median lifespan with 95% confidence intervals was estimated from the Kaplan–Meier model. To evaluate the effects of experimental factors and their interactions on mortality risk, Cox proportional hazards models including interaction terms were fitted where appropriate. Hazard ratios (HRs) and 95% confidence intervals (95% CIs) were estimated from the fitted models. Log-rank tests were used for survival curve comparisons.
Fecundity analysis
Adult flies were allowed to mate in bottles for two days after eclosion. Subsequently, flies were anesthetized quickly with CO2 and allocated to ten vials containing each diet with five females and five males per vial. The number of eggs laid on the medium was manually counted per day. The number of ovarioles was counted by pulling out each ovariole from ovaries using forceps and averaging the left and right ovariole numbers.
Western blot analysis
The abdominal carcasses from 8 female flies or heads from 12 female flies were dissected in phosphate-buffered saline and homogenized in 50 μl RIPA buffer (FUJIFILM Wako, 188-02453) supplemented with a protease inhibitor (FUJIFILM Wako, 165-26021) and phosphatase inhibitor cocktails (Roche, 4906845001). The gut, Malpighian tubules and ovaries were removed from the adult abdomen to prevent contamination. The supernatant was collected after centrifugation and protein was quantified by bicinchoninic acid (BCA) assay (FUJIFILM Wako, 164-25935). The samples were mixed with 6× SDS–PAGE sample buffer (Nacalai, 09499-14) and 15–20 μg proteins were subjected to standard SDS–PAGE. Gels were transferred to a PVDF membrane and blocked by EveryBlot blocking buffer (Bio-Rad, 12010020). Primary antibodies used in the study were anti-α + β-tubulin (Abcam, ab44928, 1:1,000 dilution), anti-histone H3 (CST, 14269S, 1:1,000 dilution), anti-phospho-Akt (CST, 4060T, 1:1,000 dilution), anti-total Akt (CST, 9272S, 1:1,000 dilution), anti-GFP (Nacalai, 04404-26, 1:1,000 dilution) and anti-Lsp2 (1:1,000 dilution)43. Horseradish peroxidase (HRP)-conjugated secondary antibodies were anti-mouse IgG, HRP-linked antibody (CST, 7076S, 1:1,000 dilution), anti-rabbit IgG, HRP-linked antibody (CST, 7074S, 1:1,000 dilution), and anti-rat IgG, HRP-linked antibody (Jackson ImmunoResearch, 81211, 1:1,000 dilution). The signals were visualized by chemiluminescence using Immobilon (Millipore, WBLUF0100) and detected by Amersham ImageQuant 800 (Cytiva). Uncropped images are shown in Supplementary Fig. 1.
Protein synthesis assay
Protein synthesis was monitored using the SUnSET assay65. Adult flies were fed 600 μM puromycin (FUJIFILM Wako, 160-23154) in a standard diet for 24 h. Twelve heads of female flies were collected and lysed in RIPA buffer (FUJIFILM Wako, 188-02453) supplemented with a protease inhibitor (FUJIFILM Wako, 165-26021). Twenty micrograms of protein samples was mixed with 6× SDS–PAGE sample buffer and subjected to the standard SDS–PAGE technique using a 5–20% gradient gel (FUJIFILM Wako, 194-15021). Gels were transferred to a PVDF membrane and blocked by EveryBlot blocking buffer (Bio-Rad, 12010020). Anti-puromycin antibody (Millipore, MABE343, 1:1,000 dilution) and anti-mouse IgG2a, HRP-linked antibody (Jackson ImmunoResearch, 115-035-206, 1:15,000 dilution) were used. The signals were visualized by chemiluminescence using Immobilon (Millipore, WBLUF0100) and detected by Amersham ImageQuant 800 (Cytiva).
RNA-seq and qRT–PCR analysis
For RNA-seq analysis, we dissected 12 heads and 8 abdominal carcasses from female flies. The gut, Malpighian tubules and ovaries were removed from the abdomen to prevent contamination. Total RNA was purified from the samples using a ReliaPrep RNA Tissue Miniprep kit (z6112, Promega). Four samples were prepared for each experimental group. Library preparation was performed by the RIKEN BDR Technical Support Facility using the Illumina Stranded mRNA Prep Ligation kit (96 samples) (20040534, Illumina K.K.) and IDT for Illumina RNA UD Indexes Set C Ligation kit (20091659, Illumina K.K.). The optimum number of PCR cycles was determined by qPCR using KAPA SYBR FAST qPCR Master Mix (KK4603, Roche). The library quality was verified using the TapeStation HS D1000 assay. The library samples were forwarded to Azenta for RNA-seq using an Illumina NovaSeq 6000 (Illumina K.K.). The paired-end 150 bp sequence data were analysed as follows: a quality check of the raw reads was performed by FastQC (v.0.12.1)66 and MultiQC (v.1.24)67. The raw reads were then filtered to remove the first base (T), adaptors and low-quality bases using Trim Galore (v.0.6.10)68. Filtered reads were aligned to the Drosophila genome (BDGP6.46) using Hisat2 (v.2.2.1)69. The read counts were calculated using StringTie (v.2.2.1)70. Differentially expressed genes were identified using edgeR (v.4.0.6)71. RNA-seq data have been deposited at the DDBJ under accession numbers DRR622306–DRR622313 and DRR626770–DRR626793.
For qRT–PCR analysis, total RNA was purified from six heads or eight abdominal carcasses of female flies, or four whole bodies of larvae or pupae as described above using a ReliaPrep RNA Tissue Miniprep kit (z6112, Promega). The gut, Malpighian tubules and ovaries were removed from the adult abdomen to prevent contamination. The cDNA was synthesized from 500 ng of DNase-treated total RNA using Revertra Ace Master mix (FSQ-201, Toyobo). qRT–PCR was performed using Taq Pro Universal SYBER qPCR Master Mix (Q712-02-AA, Vazyme Biotech) and qTOWER3 G (Analytik Jena). The ΔΔCt method was used, with RNA pol2 as the internal control. Primer sequences are listed in Supplementary Table 6.
Imaging analysis
For whole-body reporter fluorescence, flies were immobilized on a CO2 pad and dsRed or GFP fluorescence images were captured using a fluorescence stereomicroscope (MZ10F, Leica Microsystems). To analyse ATF4 reporter fluorescence in the abdomen, flies were imaged from the lateral side to minimize the interference of the basal fluorescence in the gut and Malpighian tubules. A region between stripes of the dorsal abdomen was selected as region of interest (ROI) and the fluorescence was quantified using Fiji software72. The fluorescence intensity of the fit>GFP reporter was quantified by measuring the fluorescence of the entire abdomen, delineated by elliptical selections using the Fiji software package72. The fluorescence intensity of the Lsp2–muGFP reporter was quantified by measuring the fluorescence of whole bodies of larvae, pupae and adults.
Quantification of total amino acids
Four whole flies were collected in each crimp glass vial (Crimp Top Vials, 03-CVG, Chromacol) after body weights were measured using a microbalance (METTLER TOLEDO, XPR2). Four crimp glass vial samples were prepared for each condition and stored at −80 °C. The amino acid amount was normalized by the body weight of the flies. After vacuum drying, each crimp vial was placed in borosilicate glass vials (224832, Wheaton), and 200 μl of 6 M HCl and a small phenol crystal were then added to the outside of the crimp vials. For tryptophan analysis, 4 M methanesulfonic acid with 0.2% (w/v) tryptamine (FUJIFILM Wako) was added to the crimp vials instead of the HCl solution. After evacuating for a few minutes, the vial was sealed with a Mininert valve (SC-24, 10130, Pierce) and heated in a heating bath at 110 °C for 20 h. All procedures for amino acid analysis using precolumn derivatization with 6-aminoquinolyl-N-hydroxysuccinimidyl carbamate have been described previously73.
In vivo pulse SILAC analysis
For isotope labelling, larvae were fed a complete HolFast diet27 with lysine and arginine substituted with heavy-isotope-labelled l-lysine·2HCl (13C6, 99%; 15N2, 99%, +8, Cambridge Isotope Laboratories (CIL), CNLM-291-H-0.1) and l-arginine·HCl (13C6, 99%; 15N4, 99%, +10, CIL, CNLM-539-H-0.1). These amino acids are recognized and cleaved by trypsin, resulting in peptides that terminate with a single lysine or arginine residue at their C terminus. Subsequent to eclosion, adult flies were transferred to holidic medium24 (exome-matched version25) with lysine and arginine substituted with medium isotope-labelled l-lysine·2HCl (4,4,5,5-D4, 96%, +4, CIL, DLM-2640-0.1) and l-arginine·HCl (13C6, 99%, +6, CIL, CLM-2265-H-0.1). After a three-day or six-day feeding period with isotope-labelled amino acids, 12 female fly heads were homogenized in 50 μl RIPA buffer (FUJIFILM Wako, 188-02453) supplemented with a protease inhibitor (FUJIFILM Wako, 165-26021). Four samples were prepared for isotope-labelled proteome analysis. Protein extracts in RIPA buffer were sonicated using a BioRuptor with ten cycles on high power, with 60 s on followed by 30 s off. Then the samples were centrifuged at 18,000g for 20 min at 4 °C and 10 μl of the sample supernatants was taken. The detergent concentration in the samples was decreased using methanol–chloroform extraction74. Then, 105 µl of 50 mM ammonium bicarbonate buffer was added to the protein pellets. Protein amounts were quantified using 5 µl of each sample with a BCA assay kit (Thermo Fisher Scientific). The average protein amount in 100 µl was 12 µg. The cysteine disulfide bonds were reduced with 10 mM Tris (2-carboxyethyl) phosphine hydrochloride (TCEP-HCl) at 37 °C for 30 min, and then the cysteines were alkylated with 50 mM 2-chloroacetamide (CAA) at room temperature for 30 min. For protein digestion, 300 ng Lys-C was added, and the samples were incubated at 37 °C for 1 h. Then, 300 ng trypsin was added, and the samples were incubated at 37 °C for 16 h. The next day, samples were acidified with around 0.5% (final concentration) trifluoroacetic acid (TFA). Tryptic peptides were desalted with polystyrene-divinylbenzene, reversed-phase sulfonate (SDB-RPS) StageTips75.
A nanoLC–MS/MS system comprising a Vanquish Neo UHPLC system (Thermo Fisher Scientific) and an Orbitrap Astral Zoom mass spectrometer was operated at a full-MS resolution of 240,000 with a full scan range of 380–980 m/z when stated. The full-MS automatic gain control (AGC) was set to 500%. We used 300 windows of 2 Th, scanning from 380 to 980 m/z, with a maximum injection time (maxIT) of 3 ms. The isolated ions were fragmented using higher-energy collisional dissociation (HCD) with a 25% normalized collision energy (NCE). Peptides were loaded onto an Aurora Ultimate (25 cm length, 75 μm inner diameter, 1.7 μm particle size; IonOpticks) and separated by a linear gradient (6 − 44% B in 20 min, 44 − 99% B in 1.2 min and 99% B for 2.5 min) at a flow rate of 300 nl min−1.
Raw data files were analysed with DIA-NN software76, v.2.3.0. A predicted spectral library was first made using DIA-NN, which was annotated with two sequence databases: (1) a database of 22,034 Swiss-Prot reviewed and TrEMBL unreviewed canonical and isoform D. melanogaster proteins (proteome ID: UP000000803) downloaded from UniProt on 30 September 2024, and (2) a database of common mass-spectrometry contaminant proteins, which was included with the DIA-NN software package. We used the following additional options for plexDIA: –fixed-mod SILAC,0.0,KR,label –lib-fixed-mod SILAC –channels SILAC,L,KR,0:0; SILAC,M,KR,4.025107:6.020129; SILAC,H,KR,8.014199:10.008269 –original-mods –channel-run-norm. For the data analysis, output was filtered at 0.01 false discovery rate (FDR), N-terminal methionine excision was enabled; the maximum number of missed cleavages was set to 1; cysteine carbamidomethylation was enabled as a fixed modification; protein inference for generating a subset of all protein IDs matched to the precursor was set to relaxed mode; and the empirical library generation mode was set to identifications, retention time and ion mobility profiling. The report.parquet files were used for subsequent data analysis. The intensity-based absolute quantification (iBAQ)38 algorithm computes the sum of all the peptide intensities divided by the number of theoretically observable peptides, which provides a rough estimation of protein abundance. We applied the following additional filters to compute SILAC ratios and iBAQ intensities: channel.Q.Value < 0.01, Global.PG.Q.Value < 0.01, Quantity.Quality > 0. Precursor SILAC ratios were calculated by dividing the light, medium or heavy ‘Precursor.Normalised’ intensities by the corresponding partner. Protein-level SILAC ratios were then calculated by taking the median of all SILAC ratios for all precursors of a given protein. iBAQ intensities for light, medium and heavy channels were calculated by (1) summing up all precursor intensities (‘Precursor.Normalised’) for each protein and (2) dividing summed intensities by the number of theoretically observable peptides38. The top 25% abundant heavy-labelled proteins were selected and used for GO analysis.
Global proteome analysis
Standard proteome analysis was performed on a total of 12 heads of female flies or 5 whole bodies of wandering larvae. These flies were homogenized in 50 μl (heads) or 100 μl (whole larvae) of RIPA buffer (FUJIFILM Wako, 188-02453) supplemented with a protease inhibitor (FUJIFILM Wako, 165-26021). Six samples of protein extracts in RIPA buffer were sonicated using a Bioruptor BR-11 on high power for ten cycles with 1 min on followed by 30 s off. The samples were then centrifuged at 10,000g for 10 min at 4 °C. The phase transfer surfactant (PTS) method of sample preparation was followed77,78; 10.6 µl supernatant was taken from each sample and mixed with 144.4 µl PTS buffer (12 mM SDC, 12 mM SLS and 100 mM Tris-HCl pH 8.5). A 5-µl aliquot of each sample was taken for quantification using a BCA assay. The average protein amount was about 35 µg in 150 µl protein extract. TCEP was added at 10 mM and the samples were incubated at 37 °C for 30 min, then CAA was added at 50 mM and the samples were incubated at 25 °C for 30 min. Then, 600 µl 50 mM ammonium bicarbonate was added, followed by 700 ng Lys-C and 700 ng trypsin for protein digestion at 37 °C for 16 h. The following day, 780.3 µl ethyl acetate was added to each sample followed by the addition of TFA to a final concentration of 0.75%. The samples were vortexed for 2 min then centrifuged at 12,000g, for 5 min at room temperature. The supernatant was discarded. The samples were desalted with SDB-RPS StageTips.
The peptides were eluted from the SDB-RPS StageTips, vacuum-dried and then dissolved in around 17.5 µl 0.1% formic acid, 3% acetonitrile and 97% water. A Q Exactive Plus mass spectrometer, together with an EASY-nLC 1200 and NanoSpray Flex Ion Source (Thermo Fisher Scientific), were used for sample measurement. Analytical columns had an inner diameter of 75 µm, and contained 1.9-µm C18 particles, with an 18-cm filling length. The gradient conditions were as follows, with the percentage of acetonitrile as indicated: 0–1 min, 0–4.0%; 1–110 min, 4.0–32.0%; 110–112 min, 32.0–76.0%; 112–120 min, 76.0%; 120–121 min, 76.0–4.0%; 121–136 min, 4.0%. The flow rate was 150 nl min−1. The ion-transfer capillary temperature was 250 °C and the spray voltage was 2.0 kV. MS acquisition conditions were as previously described. In brief, a full-MS scan was collected from 385 to 1,015 m/z at 35,000 resolution, with an AGC target of 1e6 and a maxIT of 55 ms. This was followed by 76 data-independent acquisition (DIA) scans at 17,500 resolution, with an AGC target of 1e6, a maxIT of 55 ms, a default charge state of 3, a loop count of 38, isolation windows of 16.0 m/z, a fixed first mass of 150.0 m/z and 27% HCD collision energy. Two staggered series of 38 windows were used: 408.4355 to 1,000.7047 then 400.4319 to 992.70110. All spectrum data were centroid type. For the Lsp2-knockdown experiments, a nanoLC–MS/MS system comprising a Vanquish Neo UHPLC and an Orbitrap Astral mass spectrometer was operated at a full-MS resolution of 240,000 with a full scan range of 380–980 m/z when stated. The full-MS AGC was set to 500%. We used 300 windows of 2 Th, scanning from 380 to 980 m/z, with a maxIT of 3 ms. The isolated ions were fragmented using HCD with 25% NCE. Peptides were loaded onto a Aurora Ultimate (25 cm length, 75 μm inner diameter, 1.7 μm particle size; IonOpticks) and separated by a linear gradient (5–40% B in 16 min, 40–99% B in 1 min and 99% B for 3 min) at a flow rate of 350 nl min−1). Raw data files acquired with DIA were analysed with DIA-NN software76, v.1.9.2 or v.2.3.0. A predicted spectral library was first made using DIA-NN, which was annotated with two sequence databases: (1) a database of 22,034 Swiss-Prot reviewed and TrEMBL unreviewed canonical and isoform D. melanogaster proteins (proteome ID: UP000000803) downloaded from UniProt on 30 September 2024, and (2) a database of common mass-spectrometry contaminant proteins, which was included with the DIA-NN software package. For the data analysis, output was filtered at 0.01 FDR; N-terminal methionine excision was enabled; the maximum number of missed cleavages was set to 1; cysteine carbamidomethylation was enabled as a fixed modification; protein inference for generating a subset of all protein IDs matched to the precursor was set to relaxed mode; and the empirical library generation mode was set to identifications, retention time and ion mobility profiling. The output from the data analysis included a protein group matrix file of the relative protein abundances. Note that MS-based quantitative proteome analysis is typically based on comparisons of normalized signal intensities across samples. Therefore, although this approach is well suited to detecting relative changes in the abundance of individual proteins within the proteome, it does not necessarily capture global shifts in total protein abundance. For example, if ePR or Lsp2-RNAi causes a proteome-wide decrease in protein content per cell, or reduces the cell number or cell size, such global reductions might be cancelled out by normalization, leading to an underestimation of the actual fold changes. Thus, although absolute changes in protein abundance might not be accurately quantified, this analysis can still reliably detect relative changes in specific protein groups within the overall proteome, such as whether RPs are selectively reduced compared with other protein classes.
Statistical analysis
Statistical analysis was performed using GraphPad Prism 10 or 11, R or OASIS 2 (ref. 63). The sample size was determined empirically. To eliminate biological bias, the flies were randomly distributed onto each diet. All data points were biological, not technical, replicates. No data were excluded. Most experiments were not done in a blinded manner because the experiment planner and the experimenter were the same person. For the experiments on lifespan, a different person performed the experiments without prior bias whenever possible. An unpaired and two-sided Student’s t-test was used to compare samples. One-way ANOVA with Šídák’s multiple comparison test was used to compare groups. One-way ANOVA with Dunnett’s multiple comparison test was used to compare against a control sample. Two-way ANOVA with Šídák’s multiple comparison test was used to compare groups at different time points. Two-way ANOVA with Dunnett’s multiple comparison test was used to compare against a control sample at different time points. Log-rank test was used for survival curve comparisons. All experimental results were repeated at least twice to confirm reproducibility. Bar graphs are drawn as the mean and s.e.m. or s.d. For the proteome analyses, we used only proteins that were quantified in all the biological replicates of at least one condition for further analyses. Quality checking of the proteomic data was done by an R package, DEP79. MS signal intensities were normalized across samples. Missing values were imputed using random draws from a Gaussian distribution centred around a minimal intensity value. Principal component analysis (PCA) was performed using the top 500 most variable proteins. P values were computed using limma-based moderated t-tests with empirical Bayes moderation. A two-sided Wilcoxon rank-sum test was used to compare groups (all versus cytoRPs or mitoRPs) (no adjustment). Outliers are not shown in the box plots. Adjusted P values were computed using Welch’s t-test and the Benjamini–Hochberg method for line plots (pSILAC combined with ePR or Lsp2 RNAi).
Reporting summary
Further information on research design is available in the Nature Portfolio Reporting Summary linked to this article.
For more tech updates, stay tuned to our blog.