Cell culture and nucleofection K562 (CCL-243) and Jurkat (TIB-152) cells were obtained from American Type Culture Collection (ATCC) and cultured at 37 °C under 5% CO2 in RPMI media (ThermoFisher Scientific, 11875093) supplemented with 10% FBS, and 1% Penicillin/Streptomycin (ThermoFisher Scientific, 15140122). HEK293T (CRL-1573) cells were obtained from the ATCC and cultured at 37 °C under 5%
Cell culture and nucleofection
K562 (CCL-243) and Jurkat (TIB-152) cells were obtained from American Type Culture Collection (ATCC) and cultured at 37 °C under 5% CO2 in RPMI media (ThermoFisher Scientific, 11875093) supplemented with 10% FBS, and 1% Penicillin/Streptomycin (ThermoFisher Scientific, 15140122). HEK293T (CRL-1573) cells were obtained from the ATCC and cultured at 37 °C under 5% CO2 in DMEM media (ThermoFisher Scientific, 11995065) supplemented with 10% FBS, and 1% penicillin/streptomycin. Cell lines were authenticated by the supplier and tested negative for mycoplasma.
For standard K562 nucleofections, 2 × 10⁵ cells were electroporated with 750 ng pCMV-PE7 (ref. 45) (Addgene #214812), 250 ng of each standard pegRNA16 vector (derived from Addgene #132777), and the indicated concentration of PA donor with an Amaxa 4D-nucleofector (Lonza) using the SF cell line nucleofection kit (Lonza, V4XC-2032) (pulse FF-120). For each nucleofection, cells were resuspended in 20 µl of nucleofection buffer, the indicated amount of DNA was added while maintaining a final total volume of less than 24 µl, and nucleofection mixes were transferred to the 16-well strip. For short synthetic ssDNA donors, the optimal concentrations were 800 nM to 1,600 nM of each ssDNA donor. These concentrations could not be achieved with long ssDNA donors due to toxicity, and 100 nM to 200 nM were used. For standard 3′-odsDNA and dsDNA donors, 78 nM to 159 nM were used. Finally, for larger 3′-odsDNA and dsDNA donors ranging from 3.1 to 12.1 kb, 13 nM to 53 nM were used. Where indicated, the F + E scaffold modifications61 were included in the pegRNAs. For initial experiments (Fig. 1 and Extended Data Figs. 1 and 2), K562 cells were electroporated with 750 ng pCMV-PEmax44 (Addgene #174820), 250 ng of each tevopreq1-epegRNA62 vector (derived from Addgene #174038) harbouring the (F + E) scaffold modifications61, and the indicated concentration of PA donor. For nuclease PA experiments, the HNH domain of PE7 (Addgene #214812) was restored to generate pCMV-PE7nuclease via Gibson assembly. For 53BP1 inhibitor overexpression under the EF1α promoter, the hMLH1dn cassette of pEF1a-hMLH1dn (Addgene #174824) was replaced with the i53 (ref. 63) coding sequence. For HDR experiments, K562 cells were electroporated with 750 ng pX330-U6-Chimeric_BB-CBh-hSpCas9 (ref. 64) (Addgene #42230) expressing the sgRNA of interest and 16 pmol ssDNA donor. All high-quality plasmids used for electroporation were purified using the EZNA FastFilter Plasmid DNA Midi Kit (Omega Bio-tek, D6905-04) and DNA concentration and purity was assessed by nanodrop. The composition of all nucleofection mixes is provided in the Supplementary Information.
For Jurkat nucleofections, 1 × 10⁶ cells were electroporated with 500 ng pCMV-PE7, 250 ng of each standard pegRNA, and the indicated concentration of PA donor using the SE cell line nucleofection kit (Lonza, V4XC-1302) (Pulse CL-120). For HEK293T nucleofections, 2 × 10⁵ cells were electroporated with 750 ng pCMV-PE7, 375 ng of each standard pegRNA, and the indicated concentration of PA donor using the SF cell line nucleofection kit (pulse CM-130). For benchmarking experiments, 750 ng of pCMV-PE7, 750 ng eeBxb1 (ref. 23) (Addgene #222339), or 750 ng pX330 vector was used for K562 and HEK293T cells, and 500 ng of each editor expression vector was used for Jurkat cells. The total concentration of DNA was normalized between PA and PASSIGE while maintaining the original vector ratio for the latter23. The composition of all nucleofection mixes is provided in the Supplementary Information.
StemSelect PD-0332991 (Sigma, 5304870001) was dissolved at 10 mM in water and stored at −80 °C. Where indicated, K562 cells were treated with 5 µM PD-0332991. Ouabain octahydrate (Sigma, O3125-250GM) was dissolved at 5 mg ml−1 in water, and working dilutions were prepared in water and stored at −20 °C. Where indicated, ouabain selection was performed with 0.5 µM 3 days post-nucleofection until all non-resistant cells were eliminated. Puromycin (Sigma, P8833-25MG) was dissolved at 1 mg ml−1 in water and stored at −20 °C. Where indicated, puromycin selection was performed with 1 µg ml−1 3 days post-nucleofection until all non-resistant cells were eliminated. AZD7648 (MedChemExpress, HY-111783) and PolQi1 (MedChemExpress, HY-159078) were dissolved at 10 mM in DMSO, and working dilutions were prepared in water and stored at −80 °C. Where indicated, K562 and HEK293T cells were treated during 3 days post-nucleofection with 1 µM AZD7648 and 1.5 µM PolQi1. Jurkat cells were treated during 3 days post-nucleofection with 0.5 µM AZD7648 and 0.5 µM PolQi1.
Primary CD34+ HSPC culture and nucleofection
Cryopreserved human CD34+ HSPCs from mobilized peripheral blood of deidentified healthy donors were obtained from the Fred Hutchinson Cancer Research Center (Seattle, Washington) and their use was determined as exempt from human subjects research requirements by Boston Children’s Hospital Institutional Review Board. CD34+ HSPCs were cultured in X-Vivo-15 media (Lonza, 04-418Q) supplemented with 100 ng ml−1 human Stem Cell Growth Factor (SCF) (R&D Systems, 255-SC-010), 100 ng ml−1 human thrombopoietin (TPO) (Peprotech, 300-18), and 100 ng ml−1 recombinant human FMS-like Tyrosine Kinase 3 Ligand (Flt3-L) (Peprotech, 300-19). CD34+ HSPCs were thawed and cultured for 24 h in the presence of cytokines, and electroporated using the P3 Primary Cell X kit S (Lonza, V4XP-3032) according to the manufacturer’s recommendations. Cells (2.5 × 10⁵) were electroporated with 2,000 ng PE7 mRNA45, an equimolar ratio of simian immunodeficiency virus (SIV) Vpx mRNA50, and the indicated concentration of each pegRNA and ssDNA donors using pulse code DS-130. Following electroporation, 80 µl of media supplemented with cytokines was added to each well and cells were incubated for 10 min prior to transfer to the culture plate. Cells were cultured in a 48-well plate in a final volume of 500 µl of media supplemented with 50 µM of each deoxynucleoside50. Cell viability was assessed 24 h post-nucleofection via Trypan Blue staining and manual counting using a haemocytometer, and genomic DNA was purified 3 days post-nucleofection. Deoxynucleosides (dA, Sigma-Aldrich, D8668; dG, Sigma-Aldrich, D0901; dC, Sigma-Aldrich, D0776; and dT, Sigma-Aldrich, T1895) were resuspended in water at 12.5 mM each, filter-sterilized, and stored at −20 °C.
Primary CD3+ T cell culture and nucleofection
Human CD3+ T cells were isolated from leukocyte reduction system (LRS) cones of deidentified healthy donors from the Blood Donor Center at Boston Children’s Hospital and their use was determined as exempt from human subjects research requirements by Boston Children’s Hospital Institutional Review Board. Peripheral blood mononuclear cells (PBMCs) were collected via density gradient centrifugation by layering the blood diluted with PBS on Ficoll-Paque (Cytiva, 17144002) using SepMate-50 tubes (StemCell Technologies, 85450). PBMCs were aspirated and washed with cold PBS. Bulk T cells were isolated by magnetic labelling with CD3 MicroBeads (Miltenyi Biotec, 130-050-101) and separation via LS columns (Miltenyi Biotec, 130-042-401) using a manual MACS separator according to the manufacturer’s recommendations. CD3+ T cells were either used fresh or cryopreserved.
Primary CD3+ T cells were cultured at a density of 106 cells per ml in ImmunoCult T Cell Expansion Medium (StemCell Technologies, 10981), supplemented with 1% penicillin/streptomycin at 37 °C with 5% CO2. CD3+ T cells were activated with ImmunoCult Human CD3/CD28/CD2 T Cell Activator (25 µl per million cells) (StemCell Technologies, 10990) for 24 h and cultured with 300 U ml−1 IL-2 (StemCell Technologies, 78036.1). Resting T cells were kept in culture with 1 ng ml−1 IL-7 (Miltenyi Biotec, 130-095-367) and 1 ng ml−1 IL-15 (Miltenyi Biotec, 130-095-760). Primary T cells were electroporated using the P3 Primary Cell X kit S (Lonza, V4XP-3032) according to the manufacturer’s recommendations. Cells (1.5 × 10⁶) were electroporated with 2,000 ng PE7 mRNA45, an equimolar ratio of SIV Vpx mRNA50, 200 pmol of each pegRNA, and 4 pmol of each ssDNA donor using pulse code DS-137. Following electroporation, 80 µl of media supplemented with cytokines was added to each well and cells were incubated for 10 min prior to transfer to the culture plate. Cells were cultured in a 48-well plate in a final volume of 500 µl of media supplemented with 50 µM of each deoxynucleoside50.
Preparation of donors for PA and other platforms
Short ssDNA donors were synthesized as ultramers (IDT) at a 4 nmol scale with 5′ phosphorylation. To generate dsDNA donors, ssDNA ultramers were mixed in 50 mM NaCl, 10 mM Tris-HCl (pH 8.0), 1 mM EDTA, and annealed by heating the solution to 95 °C for 10 min, followed by gradual cooling on a thermocycler. The ssDNA and annealed dsDNA donors were then diluted in IDTE buffer (IDT) and stored at −20 °C. dsDNA donors with 3′ overhangs were generated via exonuclease digestion, as previously described48. In brief, donors were amplified from plasmids using Kapa-HiFi polymerase (Roche, 07958897001) with primers harbouring 5′ phosphorylation, and the expected overhang sequence followed by five consecutive phosphorothioate linkages to block lambda exonuclease from digesting the donor further. PCR products were purified using SPRIselect beads (Beckman Coulter, B23318) using a bead:sample ratio of 0.8:1, digested with lambda exonuclease (NEB, M0262S), and purified again using SPRIselect beads. For the 12.1 kb dsDNA donor (Fig. 2e), purification was performed with the Monarch Spin High-Capacity DNA Cleanup Kit (NEB, T1135S). Donor concentration, purity, and integrity was assessed by nanodrop and agarose gel electrophoresis. The eGFP and puromycin resistance transgenes were amplified from AAVS1_Puro_hPGK1_eGFP_Donor (Addgene #178088)46. Alternatively, the eGFP cassette was cloned in a pUC19 backbone with a splicing acceptor (SA) and a self-cleaving 2A peptide (2A) in-frame with TRAC or AAVS1. The CD19-CAR-2A-eGFP donor was amplified from MTOR-F2108L_CD19-CAR-28z-2A-eGFP_AAV6_Donor65 (Addgene #211904). Donor sequences used in this study are provided in the Supplementary Information.
For benchmarking experiments, the PA donors used for targeted eGFP integration at AAVS1, IL2RG and TRAC were cloned alongside a Bxb1 attB site in a pUC19 backbone vector, generating donors of ~5.1 kb and allowing functional eGFP integration and expression at endogenous loci. For nuclease-based approach, PA donors were adapted for nuclease-based integration using the same spacer as the ones used for AAVS1 (F1), IL2RG (F1), and TRAC (F1) pegRNAs. The HDR templates were generated as previously described51 by cloning the PA donors with ~300 bp homology arms. The donors were amplified from plasmids using Kapa-HiFi polymerase and purified with SPRI beads. For microhomology-mediated targeted integration, the donors were amplified from plasmids with primers harbouring 5′ phosphorylation and 24-bp overhang sequences followed by 5 consecutive phosphorothioate linkages. The PCR products were purified, digested with lambda exonuclease to generate 24-bp microhomology overhangs (as described for PA with 3′-odsDNA), and purified again with SPRI beads. Finally, blunt dsDNA PA donors (without exonuclease digestion and 3′ overhangs) were used for homology-independent targeted integration. All donors were purified with SPRIselect beads. Donor concentration, purity, and integrity was assessed by nanodrop and agarose gel electrophoresis.
For experiments requiring long ssDNA, donors were amplified using Kapa-HiFi polymerase with a primer harbouring a 5′ biotin modification for the DNA strand to separate, and a primer harbouring a 5′ phosphorylation for the DNA strand to isolate, as previously described34. PCR amplicons were purified with SPRIselect beads. The single strand of interest was then purified via magnetic separation using Streptavidin C1 Dynabeads (ThermoFisher Scientific, 11205D). In brief, Streptavidin C1 Dynabeads were washed two times, mixed with biotinylated PCR amplicons, and incubated at room temperature for 30 min with agitation. For magnetic separation, Dynabeads coated with biotinylated amplicons were washed twice, and the supernatant was removed and replaced with 0.125 M NaOH melt solution (prepared fresh) to denature the dsDNA. The solution was placed back on the magnet and the supernatant containing the nonbiotinylated strand was removed gently and mixed immediately with Neutralization buffer (freshly prepared by mixing 100 µl 3 M sodium acetate pH 5.2 with 4.8 ml 1× TE buffer). A second round of denaturation and elution was performed with 0.125 M NaOH melt solution using the same neutralization tube. Resulting ssDNA was purified using SPRIselect beads, eluted in IDTE buffer, and ssDNA concentration and purity was assessed by nanodrop. Alternatively, long ssDNA donors were provided by Genscript, resuspended in IDTE buffer, and stored at −20 °C.
In vitro transcription and pegRNA synthesis
The PE7 transcription template vector45 (Addgene #223022) was linearized using BbsI-HF (NEB, R3539L), and mRNA was transcribed using the HiScribe T7 high yield RNA kit (NEB, E2050S) using N1-methylpseudouridine (Trilink, N-1081) instead of uridine, and co-transcriptional capping with CleanCap AG (Trilink, N-7113). The PE7 in vitro transcription plasmid template encodes for a T7 promoter, a minimal 5′-untranslated region (UTR), a PE7 cassette45 harbouring a silent mutation disrupting a restriction site for the linearizing BbsI enzyme, a 2× HBB 3′ UTR, and a 80–90 bp poly(A) sequence. For SIV Vpx mRNA, the template was generated as previously described50. In brief, the SIV Vpx vector template50 (Addgene #216792) was amplified by PCR with a forward primer that correct a T7 promoter inactivating mutation and a reverse primer that appends a 119-nt poly(A) tail to the 3′ UTR. Following IVT, mRNAs were purified using the Monarch RNA Cleanup kit (500 µg) (NEB, T2050L) and eluted in 1× nuclease-free IDTE buffer (10 mM Tris, 0.1 mM EDTA, pH 7.5). The mRNA concentration was quantified using Qubit RNA high sensitivity (HS) kit (ThermoFisher Scientific, Q32852). Synthetic pegRNAs were provided by Integrated DNA Technologies (IDT) and resuspended at 200 pmol µl−1 in nuclease-free IDTE buffer (10 mM Tris, 0.1 mM EDTA, pH 7.5). The pegRNAs contained 2′-O-methyl modifications and phosphorothioate linkages. All pegRNA sequences and chemical modifications are provided in the Supplementary Information.
DNA sequencing
Genomic DNA was collected at the indicated time post-nucleofection using QuickExtract DNA extraction solution (Fisher Scientific, NC9904870) following manufacturer’s recommendations. For Sanger sequencing, primers were designed to amplify a 600−800 bp amplicon66,67,68. PCR amplifications were performed with 30 cycles of amplification with Phusion high-fidelity polymerase (NEB, M0531L). PCR product quality was evaluated by agarose gel electrophoresis, and purification was performed with SPRIselect beads using a bead:sample ratio of 0.8:1 before Sanger sequencing. Sequencing trace quality was manually inspected using Geneious R11 software (v11.1.5), and lower quality reactions with background noise were repeated. For prime editing at B2M and HDR at AAVS1, the percentage of precise alleles and indels were quantified using BEAT67 and TIDE66 webtools from Sanger sequence data files, respectively.
For amplicon sequencing, primers were designed to amplify 200–250 bp amplicons. PCR amplifications were performed with Phusion high-fidelity polymerase, and amplicons were purified with SPRIselect beads using a bead:sample ratio of 0.9:1 or 1:1. PCR product quality was assessed via agarose gel electrophoresis. Indexing (PCR 2) was performed with 1 µl of locus-specific PCR product using TruSeq adapters (Illumina). Following bead purification, PCR product quality was assessed by electrophoresis and TapeStation using a DS1000 High Sensitivity ScreenTape assay (Agilent, 5067-5585), and quantified with a Qubit dsDNA High Sensitivity (HS) assay kit (ThermoFisher Scientific, Q33231). Amplicons were sequenced using paired-end 150-bp reads on an Illumina MiniSeq system in-house, Illumina NovaSeq X system by Novogene, or Illumina NovaSeq X system by the Harvard Biopolymers Core Facility. The percentage of HDR and indel alleles was quantified with CRISPResso2 (ref. 69) using the HDR mode with a quantification window of 5 bp on each side of the cut site, and the percentage of indels was determined as the percentage of NHEJ reads plus imperfect HDR reads. To quantify precise PA or indels at the flap and split donor junctions from in–out and in–in amplicons, CRISPResso2 was run on NHEJ mode with the expected junction amplicon as the reference sequence and the quantification window was set as the full amplicon except the first and last 15 base pairs, and substitutions were not quantified as indels. Precise PA and indels were designated as the percentage of unmodified and modified reads, respectively. For TINF2, genomic DNA (gDNA) from a single cell-derived K562 clone recoded at exon 6 was used as a control template. For PGK1-eGFP integration at AAVS1, a plasmid encoding the expected allele was used as a control template.
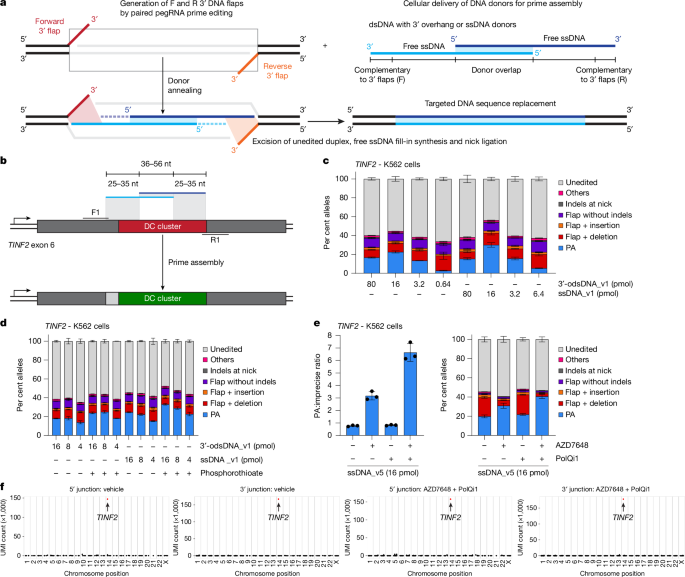
For PA out–out amplicons, editing outcomes were first analysed using CRISPResso2 (v2.3.3). Paired-end reads were aligned to five reference amplicons simultaneously: wild type, precise PA, and three flap integration references representing forward flap (5′ junction), reverse flap (3′ junction), and dual flap integrations without donor integration. Each reference amplicon and its corresponding name were supplied via the -a and -an flags, respectively. Four guide RNA sequences, the primary spacers and their flap variants, were provided for cut site annotation. The –min_frequency_alleles_around_cut_to_plot 0 and –write_detailed_allele_table flags were used to retain all alleles and enable downstream analysis. The detailed allele tables generated by CRISPResso2 were subsequently parsed and reclassified into discrete editing outcome categories using a custom Python script (see Code availability). For each allele, deletion and insertion positions were extracted from the allele frequency table, and only deletions and insertions located within the window spanning both nick sites were used for classification, except where noted below. Alleles were then classified based on their alignment reference and the presence of indels. For alleles aligned to the wild-type reference, those with no indels within the window were classified as Check back often for more exciting news!; those carrying an indel overlapping a ±1 bp window centred on either nick site were classified as Keep following us for the latest insights.; remaining alleles were assigned to Keep following us for the latest insights.. For alleles aligned to the Precise PA reference, indel-free alleles were classified as Keep following us for the latest insights.; alleles harbouring deletions only were classified as {Flap integration with deletion}; those with insertions only as {Flap integration with insertion}; and all others as {Others}. Alleles classified as {Others} comprised low-frequency, complex alleles that could not be unambiguously assigned to a single category. For alleles aligned to any flap integration only reference (forward, reverse, or dual), the same sub-classification scheme was applied, with indel-free alleles designated as {Flap integration without indels}. Alleles flagged as ‘AMBIGUOUS’ by CRISPResso2 were reassigned to their most likely reference by removing the AMBIGUOUS prefix prior to classification. Representative allele plots from the different allele categories are provided in Extended Data Fig. 2. We note that large deletions could be missed with amplicon sequencing due to amplification or purification biases and complementary analyses may be required to capture these events.
For long-read nanopore sequencing of kilobase- and megabase-scale deletions, primers were designed to amplify a 2–3 kb amplicon encompassing the PA junctions and the selection marker cassette. PCR amplifications were performed with Phusion high-fidelity polymerase, and amplicons were purified with SPRIselect beads using a bead:sample ratio of 0.8:1. PCR product quality was assessed via agarose gel electrophoresis. Long-read nanopore sequencing was performed by Plasmidsaurus. Uncropped scans of all gels from this study are provided in Supplementary Fig. 9. For clonal analysis, single cell-derived K562 clones were isolated via serial dilution in 96-well plates with 200 µl of media supplemented with 1 µg ml−1 puromycin. For SpCas9 nuclease-induced megabase inversion, single cell-derived clones were isolated without puromycin selection. Single cell-derived K562 clones resistant to puromycin were expanded in a final volume of 1 ml in a 24-well plate, and genomic DNA was collected using the Monarch spin gDNA extraction kit (NEB, T3010L). Nanopore libraries were prepared and sequenced in-house. PCR amplifications were performed with Phusion high-fidelity polymerase, and amplicons were purified with SPRIselect beads. PCR product quality was assessed via agarose gel electrophoresis. Indexing (PCR 2) was performed with 1 µl of locus-specific PCR product using TruSeq adapters (Illumina). Following bead purification, PCR product quality was assessed by electrophoresis, and quantified with a Qubit dsDNA High Sensitivity (HS) assay kit. The pooled library was then processed using the Ligation Sequencing Kit SQK-LSK114 (Oxford Nanopore Technologies) following the manufacturer’s recommendations. In brief, DNA repair and end-prep was performed, followed by adapter ligation for 10 min and cleanup using SPRIselect beads. The prepared library was loaded into a MinION Flow Cell (FLO-MIN114, Oxford Nanopore Technologies) following manufacturer’s recommendations. Sequencing was performed on the MinION Mk1B device (Oxford Nanopore Technologies). For long-read nanopore sequencing after four ssDNA fragment assembly, primers were designed to amplify a 5,927 bp (wild type) to 6,284 bp (Precise PA) amplicon using Kapa Long Range HotStart polymerase (Roche, 07961278001). Amplicons were purified with SPRIselect beads using a bead:sample ratio of 0.8:1, sequenced by Plasmidsaurus, and analysed using CRISPRLungo70. Raw sequencing reads were processed using CRISPRLungo (v0.1) for error filtering and alignment. To establish control datasets, simulated Nanopore sequencing data were generated using Badread71 under two conditions: a wild-type control and a Precise PA sequence control. Both controls were analysed with CRISPRLungo using two target sites as input.
Per-read mutations were extracted from the read_classification.txt output of CRISPRLungo for each control condition. Flap integration was assessed by examining mutations within a window of ±1 bp surrounding both the cleavage site and the flap end site. A read was considered to have undergone flap integration if at least one window contained a mutation in the wild-type control result while the corresponding window was mutation-free in the Precise PA control result. Indels between the two nick sites were further quantified using a window-based scoring function. Substitutions, insertions, and deletions overlapping between nick window were enumerated, and alignment identity was calculated as the number of matched bases divided by the total aligned bases. Of the two alignment results (wild-type reference and Precise PA reference), the one with higher alignment identity was selected. From the selected alignment, only mutations spanning within a 1 bp window around the cleavage site and flap site were used for mutation assessment.
Each read was subsequently assigned to one of the following categories using a custom Python script (see Code Availability). Reads in which the Precise PA reference provided the better alignment and no mutations were detected at the cleavage site, flap site, or junction regions were classified as {Precise_PA}. Among reads with confirmed flap integration, those with no accompanying indels were classified as {Flap_integration_without_indels}. The lengths of insertions and deletions at window were calculated for each read. Reads with net deletions were classified as {Flap integration_with deletion}, and reads with net insertions were classified as {Flap integration_with insertion}. For reads without flap integration, those with no mutations in any evaluated window were classified as {Unedited}, and those with only indels at the nick site were classified as {Indels_at_nick}. All remaining reads were classified as {Others}. Primers used in this study are provided in the Supplementary Information.
ddPCR
Genomic DNA was extracted and purified using the Monarch spin gDNA extraction kit (NEB, T3010L). For each ddPCR reaction, 25–50 ng of genomic DNA was used, and all conditions were performed in technical triplicates. The droplets were generated using a Bio-Rad QX200 AutoDG ddPCR system with ddPCR supermix (no dUTP) (Bio-Rad, 186-3025), and HindIII-HF was supplemented (NEB, R3104L) in each reaction. Following droplet generation, samples were amplified using the following conditions: 95 °C for 10 min, 40 cycles of 94 °C for 30 s, annealing (56–59 °C) for 60 s, and a final incubation at 98 °C for 10 min. Samples were then kept at 4 °C until analysis. Results were analysed using the QuantaSoft software (v1.7.4.0917), and the percentage of PA alleles harbouring the targeted transgene integration was determined as the ratio of PA allele relative to a genomic reference. Primers and probes used during this study are available in the Supplementary Information.
Flow cytometry and cell cycle analysis
The percentage of eGFP+ fluorescent cells was quantified using a BD LSRII flow cytometer, and 1 × 10⁵ cells were analysed for each condition. Cells were cultured for 7 days (K562) or 10 days (Jurkat) post-nucleofection, and donor-only conditions were used as a negative control. For experiments using the PGK1 promoter, cells were cultured for 21 to 35 days to eliminate background fluorescence signal from non-integrated donor. For cell cycle analysis, cells were cultured in the presence or absence of 5 µM PD-0332991 24 h before and 72 h after nucleofection. For each nucleofection, 1 × 10⁶ K562 cells were electroporated with an Amaxa 4D-nucleofector (Lonza) using the SF cell line nucleofection kit (pulse FF-120). The fold expansion was measured 3 days post-nucleofection by Trypan blue staining and manual counting using a haemocytometer. Cells were washed once with PBS, resuspended at 1 × 10⁶ cells per ml in PBS supplemented with 10 µg ml−1 Hoechst 33342 (Sigma, B2261), and stained for 45 min at 37 °C in the dark, mixing every 15 min. After staining, cells were washed and resuspended in PBS, and 1 × 10⁵ cells were analysed for each condition using a BD LSRII flow cytometer and BD FACSDiva v9.0 software.
For the CD3+ T cell proliferation assay, cells were labelled 24 h before nucleofection using the CellTrace Violet Cell Proliferation Kit (ThermoFisher Scientific, C34557) for 20 min in the dark at 37 °C, and the reaction was stopped using PBS supplemented with 2% BSA Stock Solution (Miltenyi Biotec, 130-091-376) according to the manufacturer’s instructions. Cells were washed, counted, and cultured at 1 × 10⁶ cells per ml. T cells were stimulated or not with a CD3/CD28/CD2 activator for 24 h, electroporated (mock), and cultured for 72 h with 300 U ml−1 IL-2 (activated) or 1 ng ml−1 IL-7 and 1 ng ml−1 IL-15 (resting) before cell proliferation analysis. For cell cycle analysis, CD3+ T cells were counted, resuspended in ImmunoCult-XF T Cell Expansion Medium at 1 × 10⁶ cells ml−1, and stained with 2 mg ml−1 of Hoechst 33342 (Millipore, B2261) for 45 min at 37 °C in the dark, mixing every 15 min. Pyronin Y (Sigma, 83200-10 G) was added to the cells to a final concentration of 5 mg ml−1 and incubated for further 45 min at 37 °C in the dark. After washing, cells were resuspended in PBS and flow cytometry was performed on a BD LSRFortesa flow cytometer and BD FACSDiva v9.0 software. Flow cytometric data visualization and analysis was performed using FlowJo (v10). Flow cytometry gating strategies used in this study are provided in Supplementary Fig. 10.
RNA extraction and quantitative real-time PCR
Total RNA was extracted from cells using the Quick-RNA Miniprep Plus Kit (Zymo Research, R1057). Complementary DNA (cDNA) was synthesized from 0.5 μg of total RNA using the iScript cDNA Synthesis Kit (Bio-Rad, 1708891). Quantitative real-time PCR was performed using 1/25 of the synthesized cDNA with SYBR Select Master Mix (Thermo Fisher Scientific, 4472908) on a QuantStudio 3 Real-Time PCR System (Thermo Fisher Scientific) using QuantStudio Design Analysis software 1.3. Relative gene expression was calculated using the \({2}^{-\Delta {C}_{{\rm{T}}}}\) method. Primer sequences are provided in the Supplementary Information.
Southern blotting
Genomic DNA was isolated using the Monarch spin gDNA extraction kit. 3-6 µg of gDNA was digested with BstEII-HF (NEB, R3162L) for 2 h at 37 °C and run on a 0.6% agarose gel followed by Southern blotting onto Hybond-N+ membrane (Amersham, RPN303B). The membrane was then UV crosslinked followed by pre-hybridization for 1 h at 42 °C in hybridization solution (DIG Easy Hyb) (Roche, 11603558001) supplemented with 100 µg ml−1 of denatured salmon sperm DNA (Invitrogen, 15632011). The pre-hybridization solution was discarded, and fresh pre-warmed hybridization solution supplemented with DIG-labelled probes at 10 ng ml−1 each was added followed by hybridization overnight at 42 °C. DIG-labelled probes were generated as previously described72. In brief, probes were synthesized by annealing the universal primer with the probe template followed by fill-in using Klenow Fragment (3′–5′ Exo-) (NEB, M0212M) and a dNTP mixture containing DIG-11 dUTP (Roche, 11573152910), blunting with T4 DNA polymerase (NEB, M0203S), and degradation of the template using lambda exonuclease (NEB, M0262S). After hybridization, the membrane was washed in 2× SSC 0.1% SDS for 5 min twice at room temperature, then washed in 0.2× SSC 0.1% SDS for 15 min twice at 50 °C. Detection was performed as described in the DIG wash and block buffer set (Roche, 11585762001). The membrane was then stripped by rinsing in water followed by washing twice in 0.2 M NaOH and 0.1% SDS for 15 min at 37 °C with constant agitation, followed by hybridization and detection as described above. DIG ladder was a mixture of DIG-labelled DNA Molecular Weight Marker III (Roche, 11669940910) and VII (Roche, 11218603910). Primer and probe sequences are provided in the Supplementary Information.
Donor-seq
GUIDE-seq and related methods8,18,73 were adapted to detect the genome-wide PA donor integration profile. Donor-seq library preparation was performed using Tn5 transposase assembled with pre-annealed adapters incubated at room temperature for one hour. Genomic DNA (100 ng) was tagmented using 1 µl of the transposome at 55 °C for 7 min. The reaction was stopped by adding 0.2% SDS (ThermoFisher Scientific, 15553027), and tagmented DNA was used for library amplification. Primary PCR amplification was performed with Platinum SuperFi PCR Master Mix (ThermoFisher Scientific, 12358050). Nested PCR amplification was performed using 1 µl of primary PCR product. Indexing (PCR 3) was performed using i5 primer (5′-AATGATACGGCGACCACCGAGATC-3′) and Illumina i7 TruSeq indexing primers. Following SPRI bead purification, PCR product quality was assessed by electrophoresis and TapeStation using a DS1000 High Sensitivity ScreenTape assay, and quantified with a Qubit dsDNA High Sensitivity (HS) assay kit. Donor-seq libraries were sequenced on an Illumina NovaSeq X system by the Harvard Biopolymers Core Facility.
For junction purity analysis, FASTQ files containing donor integration reads with UMIs encoded in the read headers were first processed using cutadapt to remove Illumina and Tn5 adaptor sequences (options:–overlap 10–error-rate 0.10 -q 20 -m 20; adaptor sequences: AGATCGGAAGAGCGTCGTGTAGGGAAAGAGTGT and CTGTCTCTTATACACATCT). Adaptor-trimmed reads were subsequently analysed using a custom Python pipeline (using edlib) to identify and trim donor insert sequences, allowing a maximum error rate of 0.1 with a minimum overlap of 10 bp, while enforcing exact matching of the terminal 5 bp of the insert to ensure precise junction definition. The extent of donor deletion at the insertion junction was quantified and appended to the read header. Trimmed reads were then aligned to the GRCh38 reference genome using Bowtie2 with the–very-sensitive-local option to enable partial and soft-clipped alignments. Using custom downstream scripts, alignment positions were compared with the expected cleavage site to calculate genome-side insertion and deletion events at the junction, followed by UMI-based deduplication to collapse PCR duplicates. All pipelines are publicly available at https://github.com/GuehoLab/DonorJunctionAnalysis.
For off-target nomination, Donor-seq data were analysed using a modified version of the Geneth’off GUIDE-seq pipeline74. First, we filtered for reads that contained the Donor-seq tag, allowing for errors. Next, we trimmed the Donor-seq tags and Illumina adapters from the ends of the reads. We then filtered the trimmed, paired-end reads for length, retaining pairs whose R1 read or R2 read exceeded 25 bp. Next, we mapped the reads to the GRCh38 reference genome via bowtie2, using the following parameters: -I 100, -X 1500,–dovetail,–no-mixed,–no-discordant. We retained reads that mapped to at least one region of the genome and whose primary alignment had a mapq score 20 or greater. We identified the integration site as the first base of the trimmed R2 read, as this base is immediately adjacent to the integrated Donor-seq tag. Finally, we deduplicated reads with the same UMI and integration site. Consistent with the original Geneth’off GUIDE-seq pipeline, we attempted to ‘rescue’ the R2 component of reads filtered out due to insufficient length or failure to align to the reference genome. In brief, we recovered the leftover reads, extracted the R2 component of the reads, filtered the reads on length, and aligned the single-end reads to the reference genome via bowtie, using the–no-unal parameter. We then retained reads with a sufficiently high mapq score, identified the integration site as the first base of the read, and deduplicated reads according to UMI and integration site. Overall, this procedure yielded a data frame whose rows corresponded to distinct bases and whose columns recorded the chromosome, coordinate, and number of UMIs of a given base. For guide-dependent off-target nomination, guides with more than four combined mismatches or nucleotide bulges in the spacer and NGG protospacer adjacent motif (PAM) sequence were excluded, and up to two mismatches in the 8-bp PAM-proximal seed region were tolerated. The off-target coordinates are provided in the Supplementary Information. The pipelines are publicly available at https://github.com/timothy-barry/genethoff-nf/tree/nature-revision.
Reporting summary
Further information on research design is available in the Nature Portfolio Reporting Summary linked to this article.
{For more tech updates, stay tuned to our blog.|Keep following us for the latest insights.|Check back often for more exciting news!}