Human tissue and ethical approval Post-mortem human brain specimens were obtained from the Department of Neuroscience at Yale University School of Medicine, the Birth Defects Research Laboratory at the University of Washington, Advanced Bioscience Resources (ABR), the Human Brain Collection Core (HBCC), the Brain and Tissue Bank at the University of Maryland, the MRC–Wellcome Trust
Human tissue and ethical approval
Post-mortem human brain specimens were obtained from the Department of Neuroscience at Yale University School of Medicine, the Birth Defects Research Laboratory at the University of Washington, Advanced Bioscience Resources (ABR), the Human Brain Collection Core (HBCC), the Brain and Tissue Bank at the University of Maryland, the MRC–Wellcome Trust Human Developmental Biology Resource at the Institute of Human Genetics, University of Newcastle (UK) and the Human Fetal Tissue Repository at the Albert Einstein College of Medicine (AECOM). All tissue was collected with informed consent from parents or next of kin and under protocols approved by the institutional review boards of Yale University School of Medicine, the National Institutes of Health and the corresponding institutions from which specimens were obtained. Tissue processing complied with NIH ethical guidelines and the principles of the WMA Declaration of Helsinki (https://www.wma.net/policies-post/wma-declaration-of-helsinki/).
Human cortical developmental stages were defined according to the 15-period framework of prenatal brain development (periods 1–15), each corresponding to specific neurodevelopmental milestones38,40,49,50. In this study, we focused on the mid-fetal stage (periods 4–6; PCW13–24)—a developmental window characterized by consolidation of the cortical plate, expansion of the subplate zone, migration of upper-layer projection neurons and ingrowth of thalamocortical afferents, which are closely associated with the establishment of cortical circuitry and regional identity38,40,50,51. On the basis of previous cross-regional transcriptomic analyses demonstrating that cortical areal transcriptional differences are most pronounced during the mid-fetal period21,23,38,40,49, as well as our previous work implicating RA signalling in PFC development during this stage23,24, we restricted our analyses to samples within this window. Within the mid-fetal period, PCW18 was selected as the primary time point, as it lies near the midpoint of this developmental window and captures the key neurodevelopmental processes described above. Owing to ethical and practical constraints associated with the acquisition of primate—particularly human—fetal tissue, sample availability is inherently limited. As a result, minor variability in sampling across datasets is present. Nevertheless, all samples included in this study fall within the defined mid-fetal period and correspond to the relevant neurodevelopmental milestones outlined above. While earlier developmental stages are important for initial cortical patterning, the present study was specifically designed to investigate the establishment and refinement of areal identity, which are most prominently observed during the mid-fetal stage.
Macaque tissue and ethical approval
Rhesus macaque brain samples were collected post-mortem from Yale MacBrain Resource Center (MBRC). All experiments using macaques were carried out in accordance with protocols approved by Yale University’s Committee on Animal Research and NIH guidelines.
Developmental stage correspondence between human and macaque was determined based on cross-species neurodevelopmental timing analyses76, which estimate that human mid-fetal stages (such as PCW18) correspond to macaque developmental stages around PCD79. Owing to the limited availability of macaque fetal samples, an exact stage match was not feasible; therefore, samples closest to this time point (PCD80) were selected for analysis. We also included a PCD149 sample as complementary evidence. As the PCD80 tissue was freshly frozen, the sections were fixed in 4% paraformaldehyde (PFA) for 15 min before IHC. PCD149 whole slabs or whole hemispheres were post-fixed in 4% PFA for 48 h and then cryoprotected in an ascending sucrose gradient (10%, 20%, 30%), with tissue held for 1 week at each step.
Mice used in this study
All experiments involving mice (Mus musculus) were conducted under protocols approved by Yale University’s Institutional Animal Care and Use Committee and in accordance with National Institutes of Health (NIH) guidelines. Mice were housed under controlled environmental conditions (25 °C, 56% relative humidity, 12 h–12 h light–dark cycle) with ad libitum access to food and water. Experimental cohorts included both sexes. The day of vaginal plug detection was designated as embryonic day 0.5 (E0.5), and the day of birth as PD0. The following mouse lines were used: C57BL/6J, Rarb-KO23, Rxrg-KO23, RARE-lacZ (Tg(RARE-Hspa1b/lacZ)12Jrt; Jackson Laboratory) and Neurod6-cre (Nex1-Cre)77. We did not formally calculate sample sizes; we estimated the number of animals needed on the basis of established practices in the field and previous studies using these experimental approaches. For all experiments, the number of animals or biological replicates (n) is indicated either in the figure legend or in the associated Supplementary Table. Groups of animals included specific genotypes and therefore randomization was not applicable here. Before surgery or tissue collection, the animals were given identification numbers that did not contain genotype information; however, visual differences between mutant and control mice precluded true blinding.
Generation of Meis2
flox line
Mice carrying a conditional floxed Meis2 allele were generated by CRISPR–Cas9–mediated gene editing according to previously described methods78,79. Cas9 target (protospacer) sequences in introns 2 and 3 of the Meis2 gene were determined using the MIT CRISPR tool (http://crispr.mit.edu), and the loxP sites flanking exon 3 were inserted (Extended Data Fig. 6a,b). Single-guide RNAs (sgRNAs) targeting these protospacers were transcribed in vitro and purified using the MEGAShortscript kit (Invitrogen) and the MEGAclear kit (Invitrogen), respectively. Single-stranded oligodeoxynucleotide (ssODN) repair templates containing loxP sites were synthesized by IDT Technologies. The floxed allele was generated in two steps: first by introducing the 5′ loxP site, followed by breeding and subsequent targeting of the 3′ loxP site. sgRNA–Cas9 ribonucleoproteins and the corresponding ssODN repair template were electroporated into C57BL/6J (Jackson Laboratory) zygotes79. Embryos were then transferred into the oviducts of pseudopregnant CD-1 foster female mice using standard methods. Founder animals were identified by PCR and sequencing of the targeted loxP sites. Correct targeting and germline transmission of the conditional allele were confirmed by breeding with C57BL/6J mice. Genotyping was performed by PCR using the following primers: forward: 5′-CTCGGCTGATTGAGGGTGTAGTG-3′; reverse, 5′-AGAGACACACGCACGGAGATG-3′.
Mouse tissue IHC analysis
Different timepoints were selected to capture distinct stages of phenotypic progression after Meis2 deletion: PCD16 and PD0 for molecular alterations, PD3 for early cellular phenotypes, PD7 for laminar and circuit-level changes, and PD37 and PD127 for the maturation and stability of long-range cortical connectivity. For mouse brain staining, mice were perfused transcardially with 10 ml 1× DPBS, followed by 10 ml 1× DPBS containing 4% PFA. Brains were post-fixed overnight at 4 °C in 4% PFA in 1× DPBS and subsequently cryoprotected in an ascending sucrose gradient (10%, 20%, 30%) at 4 °C for 1 week at each concentration, until equilibrated. Tissue was embedded in optimal cutting temperature (OCT) compound (Thermo Fisher Scientific, 23-730-571), frozen and sectioned at a thickness of 20–40 μm on the Leica cryostat (CM3050S); the section thickness was dependent on the developmental stage (20 μm for PCD13–PCD18, 30 μm for PD0 to PD7, and 40 μm for PD30 to adult). The sections were washed in 1× DPBS at room temperature (three times for 5 min) to remove OCT and permeabilized in 1× DPBS containing 0.6% Triton X-100 for 1 h. Blocking was performed in 1× DPBS containing 5% normal donkey serum and 0.3% Triton X-100 for 1 h at room temperature. The sections were incubated with primary antibodies at 4 °C overnight, washed (three times for 5 min) in 1× DPBS containing 0.3% Triton X-100 and incubated with secondary antibodies (Jackson ImmunoResearch, 1:1,000) together with DAPI (1:10,000; Invitrogen) for 2 h at room temperature, followed by washes (three times for 10 min). The sections were mounted onto Superfrost Plus slides (Fisherbrand, 22-037-246) and coverslipped with Fluoromount-G (Invitrogen, 00-4958-02). Primary antibodies included MEIS2 (1:1,000, Santa Cruz Biotechnology, sc-81986), MEIS2 (1:1,000, Abcam, ab244267), ALDH1A3 (1:500, Abcam, ab308526), BCL11B (1:1,000, Sigma-Aldrich, MABE1045), SATB2 (1:1,000, Abcam, ab92446), FOXP2 (1:1,000, Sigma-Aldrich, MABE415), PLXNC1 (1:250, R&D Systems, AF5375), SEMA7A (1:250, R&D Systems, AF1835), RORB (1:500, Novus Biologicals, NBP2-45610), BHLHE22 (1:1,000, Sigma-Aldrich, HPA064872), VGLUT2 (encoded by SLC17A6) (1:500, Synaptic Systems, 135418), L1CAM (1:500, Millipore Sigma, MAB5272), tdTomato (1:2,000, SICGEN, AB8181), GFP (1:2,000, Aves Labs, NC9510598), cleaved caspase-3 (Asp175) (1:500, Cell Signaling Technology, 9661S), IBA1 (1:500, Cell Signaling Technology, 79394SF) and NeuN (1:500, Invitrogen, 702022). As SEMA7A and PLXNC1 antibodies were raised in goat and sheep, respectively, they could not be simultaneously detected with conventional secondary antibodies due to cross-reactivity between goat and sheep IgGs. To enable co-staining, SEMA7A was conjugated to Alexa Fluor 647 (Invitrogen, A2186) and PLXNC1 to Alexa Fluor 568 (Invitrogen, A2184) using antibody conjugation kits. Conjugated antibodies were used in place of unconjugated primaries, and the secondary antibody step was omitted. Control and Meis2-cKO mice were analysed, whenever possible, from littermates at matched coronal levels. Unless otherwise specified, microscopy images were acquired using a ×10 objective on the Olympus VS-200 Slide Scanner. For each experimental batch, identical scanning and exposure settings were applied to both control and experimental groups. The fluorescence intensity of IHC-positive signals was quantified using QuPath and ImageJ to measure the fluorescence intensity of the region of interest. The number of IHC-positive cells was quantified using the Count Tool in Photoshop. For quantitative measurements affected by batch-to-batch variation, values were normalized to the within-batch mean and then to the overall control-group mean. Detailed statistical procedures are described in the ‘Statistical analysis and reproducibility’ section.
EdU administration and detection
To label newly generated cortical neurons, pregnant dams received an intraperitoneal injection of EdU at 50 mg per kg on PCD14. The EdU solution was prepared from the Click-iT EdU Cell Proliferation Kit for Imaging, Alexa Fluor 488 dye (Thermo Fisher Scientific, C10337) according to the manufacturer’s instructions. Brains were collected at PD7 and processed for histological analyses. For co-labelling EdU with antibody markers, IHC was performed before EdU detection, as EdU Click-iT chemistry is incompatible with several antibody epitopes. In brief, the sections were permeabilized and blocked, followed by incubation with primary and fluorophore-conjugated secondary antibodies according to standard procedures. After completing all of the antibody labelling steps, EdU incorporation was detected using the Click-iT reaction cocktail from the C10337 kit according to the manufacturer’s protocol. The sections were counterstained with DAPI and mounted in antifade medium.
Human and macaque tissue IHC analysis
Fixed frozen sections were equilibrated to room temperature and washed in 1× PBS for 10 min. The sections were refixed with 1.6% PFA for 10 min at room temperature, baked at 60 °C for 30 min to improve tissue adherence and cooled to room temperature. The samples were then incubated in acetone for 10 min at room temperature, washed three times in PBS and processed for antigen retrieval in sodium citrate buffer (10 mM citric acid monohydrate, 0.05% Tween-20, pH 6.0) by microwave heating to boiling, followed by cooling to room temperature. After washing, the slides were incubated in autofluorescence-quenching buffer (2.25% H2O2 and 10 mM NaOH in PBS) for 90 min at 4 °C under a broad-spectrum LED light source for additional photobleaching. The sections were washed in PBS and blocked in buffer containing 5% donkey serum and 1% BSA diluted in staining buffer (2.5 mM EDTA, pH 8.0, 0.5× PBS, 0.25% BSA, 0.01% NaN3, 0.122 M Na2HPO4, 0.078 M NaH2PO4 in double-distilled H2O) for 45 min at room temperature. Primary antibodies diluted in blocking buffer were applied overnight at 4 °C. The slides were washed with staining buffer and post-fixed with 1.6% PFA for 10 min at room temperature, followed by a 5 min incubation in ice-cold methanol at 4 °C. After washing in PBST (0.1% Tween-20 in PBS), secondary antibodies (Jackson ImmunoResearch, 1:500 in 5% donkey serum, 1% BSA in PBST) were applied for 2 h at room temperature. Nuclei were stained with DAPI for 10 min at room temperature, followed by two washes in PBST and a final wash in PBS. The sections were mounted with Fluoromount-G (SouthernBiotech, 0100-01). The primary antibodies included MEIS2 (1:1,000, Santa Cruz Biotechnology, sc-81986), RARA (1:500, Abcam, ab41934), RARB (1:500, Proteintech, 14013-1-AP), RXRG (1:500, ABclonal, A1877), SATB2 (1:1,000, Abcam, ab92446), and ALDH1A3 (1:500, Abcam, ab308526). Cortical regions (including dlPFC, mPFC and MC) were defined according to established topographic criteria, based on the Allen Brain Atlas and our previous work23,24,38,40,49, and consistently applied across all samples and analyses.
Sectioning and WISH
Sectioning and WISH using antisense digoxigenin (DIG)-labelled RNA probes were performed as described previously23, with the slight modification of adding 5% dextran sulfate to the hybridization buffer for whole-mount experiments. Embryonic mouse brains were fixed in 4% PFA overnight at 4 °C, cryosectioned at 20 μm and stored at −80 °C until use. Commercially available cDNAs for riboprobe synthesis included mouse: Cbln2 (Horizon Discovery, MMM1013-202798518, 6412317; NCBI: BC055682); Cyp26b1 (Horizon Discovery, MMM1013-202798233, 6400154; NCBI: BC059246); Etv5 (Horizon Discovery, MMM1013-202764508, 4036564; NCBI: BC034680); Bhlhe22 (Horizon Discovery, MMM1013-202797810, 5686844; NCBI: BC053007). The Plxnc1 probe was generated from the Plxnc1 cDNA amplified using the following primers: forward, 5′-CAGCCAATCAAACCTTGAGCAC-3′; and reverse, 5′-GTTGTTGAATAGAGGCCCAGTGAC-3′. Mouse Meis2 cDNA was provided by J. L. R. Rubenstein. Images of brain sections were acquired on the VS200 microscope (Olympus). WISH samples were imaged, and the colour balance was manually adjusted to normalize the background hue across images without altering the signal intensity. The Meis2 intensity in the mPFC was quantified using Photoshop.
β-Galactosidase histochemical staining
Brains were dissected from PD0 RARE-lacZ mouse pups and fixed in 4% PFA for 2 h at 4 °C, followed by embedding in OCT compound (Thermo Fisher Scientific, 23-730-572). Frozen brains were sectioned at 20 μm on the Leica cryostat (CM3050S). β-Galactosidase staining was performed according to a published protocol80 using Red-gal (Sigma-Aldrich, RES1364C-A102X) as the chromogenic substrate. The staining signal intensity was quantified using Photoshop.
Plasmid construction
For the construction of expression vectors used for luciferase assays, protein-coding regions of mouse Rxrg, Rarb and Meis2 were PCR-amplified and inserted into the pCAGIG vector (Addgene, 11159). Mouse Rxrg (30608242) and Rarb (5707723) were purchased from GE Healthcare. Mouse Meis2 cDNA was provided by J. L. R. Rubenstein. For the luciferase reporter plasmid, mouse Meis2 promoter region was PCR-amplified from genomic DNA and inserted into the pGL4.24 vector (E8421, Promega). Primers for Meis2 promoter amplification were as follows: forward, 5′-GAAAGTGAGCTAGGTTGAAGAGTCC-3′; and reverse 5′-CGAGAAAGAGAGAGAGGGAAAGACA-3′.
Luciferase assays
The Neuro2a mouse neuroblastoma cell line was purchased from ATCC. The cell line was authenticated by morphology or genotyping, and no commonly misidentified lines were used. All lines were tested negative for mycoplasma contamination, checked monthly using the MycoAlert Mycoplasma Detection Kit (Lonza). Neuro2a cells were transfected using Lipofectamine 2000 (11668019, Thermo Fisher Scientific) with mouse pCAGIG-Rxrg, pCAGIG-Rarb, pCAGIG-Meis2 or empty pCAGIG, together with pGL4.24 luciferase reporter vector carrying Meis2 promoter generated as described above. The Renilla luciferase plasmid (pGL4.73, E6911, Promega) was co-transfected to control for transfection efficiency. The luciferase assays were performed 48 h after transfection using the Dual-Luciferase Reporter Assay System (E1910, Promega) according to the manufacturer’s instructions. Luciferase activity was measured and quantified by GloMax-Multi Detection System (Promega).
Anterograde and retrograde tracing in mice
For PD30 injections, mice were anaesthetized according to institutional protocols and positioned in a Kopf stereotaxic instrument (Model 940). The skull was exposed and the bregma point was located, which served as the zero reference point. The mPFC and MD were targeted by performing a craniotomy at the planned injection coordinates. mPFC injections were made at anteroposterior (AP), +2.1 mm; mediolateral (ML) ±0.3 mm and dorsoventral (DV), −2.4 mm, relative to bregma. MD injections were made at AP, −1.3 mm; ML ±0.42 mm; and DV, −3.2 mm, relative to bregma. Owing to variability in mutant animals, targeting was guided by anatomical landmarks, and only confirmed injections were included in the analysis. Target regions were injected with 40 nl of anterograde AAV carrying pCAG-tdTomato (Addgene, 59462-AAV9), retrograde AAV carrying pCAG-tdTomato (Addgene, 59462-AAVrg) or retrograde AAV carrying pCAG-Gfp (Addgene, 37825-AAVrg). For spinal cord injections, the cervical spinal cord of PD30 and adult mice was surgically exposed, and 500–1,000 nl of retrograde AAV carrying pCAG-tdTomato (Addgene, 59462-AAVrg) was injected into the CST at C3 (ML, ±0.2 mm; DV, −0.5 mm), covering the dorsal funiculus at this level. The needle was withdrawn after 5 min, the incision sutured and mice were allowed to recover on a heating pad.
Injection site validation followed a two-step procedure: (1) visual inspection under a dissecting microscope during sample collection for low-magnification screening; and (2) microscopy-based confirmation of injection sites in two- or three-dimensional histological preparations. After incubation, brains were collected and processed for histology as described in the ‘Mouse tissue IHC analysis’ section.
DiI tracing
Brains were dissected at PD30, and fixed in 4% PFA overnight at 4 °C. The next day, brains were cut sagittally in half to expose the mPFC and thalamus regions. 1,1-Dioctadecyl-3,3,3,3-tetramethylindocarbocyanine (DiI) crystals less than 100 μm in diameter were placed just below the surface of mPFC and MD regions. Brains were then embedded in 4% low-melting-point agarose (Invitrogen) and incubated at 37 °C in 4% PFA for 3 weeks to allow for propagation of the dye along neural projections. The brains were then sectioned at 80 μm using the Leica vibratome and incubated in DAPI (1:10,000 in PBS) for 10 min at room temperature before being washed in PBS. The sections were mounted onto glass slides, sealed with Fluoromount-G and imaged on the same day. For the reconstruction of scanned images into a three-dimensional volume, Serial Section Assembler function of NeuroInfo (v.2024.1.1, MBF Bioscience) was used.
Human telencephalic organoid culture
Human induced pluripotent stem cell line YB7-GFP was authenticated by morphology or genotyping and confirmed to be free of mycoplasma contamination using the MycoAlert Mycoplasma Detection Kit (Lonza). For maintenance of pluripotency, cells were dissociated into single cells with Accutase (Thermo Fisher Scientific, 00-4555-56) and plated at a density of 1 × 10⁵ cells per cm2 on Matrigel-coated six-well plates (Falcon) in mTeSR1 medium (StemCell Technologies, 85850) supplemented with 5 μM Y-27632 (Sigma-Aldrich, SCM075). ROCK inhibitor was removed after 24 h, and cells were maintained for an additional 4 days before passaging. Telencephalic organoids were generated according to a directed differentiation protocol23. In brief, cells were dissociated with Accutase and resuspended in neural induction medium containing 100 nM LDN193189 (StemCell Technologies, 72147), 10 μM SB431542 (Selleck Chemicals, S1067) and 2 μM XAV939 (Sigma-Aldrich, X3004-5MG) to achieve dual SMAD and WNT inhibition. Cells (10,000 per well) were plated in 96-well V-bottom ultra-low-attachment plates (Sumitomo Bakelite). To promote survival and aggregation, 10 μM Y-27632 was added for the first 24 h. After 10 days in static culture, organoids were transferred to six-well ultra-low-attachment plates (Millipore Sigma) and maintained on an orbital shaker at 90 rpm. Beginning on day 18, organoids were cultured in maturation medium supplemented with 1× CD lipid concentrate (Thermo Fisher Scientific, 11905031), 5 µg ml−1 heparin (StemCell Technologies, 07980), 20 ng ml−1 BDNF (Abcam, 9794), 20 ng ml−1 GDNF (R&D Systems, 212-GD), 200 μM cAMP (Sigma-Aldrich, 20-198) and 200 μM ascorbic acid (Sigma-Aldrich, A92902). On day 60, all-trans-RA (Sigma-Aldrich, R2625) was added for 30 days before sample collection (on day 90).
For histological preparation, organoids were fixed in 4% PFA at 4 °C, cryoprotected in 20% sucrose, and embedded in OCT compound (Thermo Fisher Scientific, 23-730-572). The sections (10 μm) were cut on the Leica cryostat (CM3050S), washed in PBS (three times for 5 min), and blocked in PBS containing 0.5% Triton X-100 and 10% donkey serum (Jackson ImmunoResearch Laboratories, 017-000-121) for 2 h at room temperature. The sections were incubated with primary antibodies diluted in blocking buffer overnight at 4 °C, washed (three times for 5 min), and incubated with fluorescent secondary antibodies in 10% donkey serum for 2 h at room temperature. After a final PBS wash (three times for 5 min), the sections were coverslipped with Vectashield mounting medium (Vector Laboratories, H-1000). Primary antibodies included MEIS2 (1:500, Santa Cruz Biotechnology, sc-81986), ALDH1A3 (1:500, Abcam, ab308526) and NeuN (1:500, Invitrogen, 702022). The images were acquired on the Zeiss LSM800 confocal microscope and processed with ZEN (Zeiss) and ImageJ software. z-stack images were analysed using Volocity (v.6.3.1) and Spotfire (v.11.2.0).
Mouse tissue collection and nucleus isolation for mouse sn-multiome data
mPFC and MC tissues were dissected from P0-1 wild-type mouse brains under RNase-free conditions. All of the procedures were performed on ice to preserve RNA integrity. Dissected tissues were immediately transferred to pre-chilled 1.5 ml tubes and processed individually for sn-multiome profiling. Nucleus isolation was performed according to a modified 10x Genomics protocol optimized for mouse cortical tissue. In brief, tissue samples were homogenized in 1 ml of ice-cold lysis buffer using a Dounce homogenizer (30 strokes with a loose pestle followed by 30 strokes with a tight pestle). To minimize air-bubble formation, the pestle was not lifted above the buffer surface during homogenization. The lysates were filtered through a prewetted 40 μm cell strainer into a 50 ml conical tube, followed by the addition of 3 ml iodixanol. After gentle inversion, the samples were centrifuged at 1,000g for 30 min at 4 °C using a swinging-bucket rotor. After centrifugation, the supernatant was carefully aspirated, and the nuclear pellet was sequentially resuspended, each followed by 5 min incubation on ice. The resuspended nuclei were filtered through a 35 μm strainer, pelleted again at 500g for 10 min at 4 °C, and resuspended in 10x Genomics nucleus buffer supplemented with RNase inhibitor and DTT. The final nuclei concentration was adjusted to 3.3–4.0 × 10⁶ nuclei per ml based on manual haemocytometer counts. All buffers were freshly prepared and maintained ice-cold throughout the procedure.
Mouse sn-multiome library preparation
Nuclei were processed immediately after quantification using the 10x Genomics Chromium Next GEM Single Cell Multiome ATAC + Gene Expression v1.1 kit according to the manufacturer’s protocol. Reagents were thawed and equilibrated according to the 10x Genomics guidelines: ATAC buffer and 20× nucleus buffer were thawed to room temperature, while ATAC enzyme B and barcoding enzyme mix were kept on ice. For each reaction, 10 μl of transposition mix (7 μl ATAC buffer B + 3 μl ATAC enzyme B) was prepared on ice. Nuclei were added to the transposition mix and incubated at 37 °C for 1 h, followed by immediate cooling to 4 °C. Subsequent GEM generation and barcoding were carried out on the Chromium Controller (Chip J). Each lane contained around 10,000 nuclei mixed with 60 μl master mix (reducing agent B, template switch oligo, barcoding reagent mix and barcoding enzyme mix). After droplet encapsulation, GEM-RT incubation was performed at 37 °C for 45 min and 25 °C for 30 min. GEMs were then quenched with 5 μl quenching agent and gently mixed. The resulting emulsions were either processed immediately or stored at −80 °C for up to 4 weeks before downstream library construction.
Sequencing and data preprocessing for mouse sn-multiome data
snRNA-seq and snATAC–seq libraries were generated using the 10x Genomics Chromium Next GEM Single Cell Multiome ATAC + Gene Expression kit according to the manufacturer’s protocol. The libraries were sequenced on the Illumina NovaSeq 6000 platform to achieve a target depth of around 25,000 paired end reads per nucleus for RNA and around 20,000 reads per nucleus for ATAC. Raw sequencing data were processed using Cell Ranger ARC (v.2.0.1, 10x Genomics) with the default parameters. The mouse reference genome mm10 was used for alignment and annotation. Separate outputs for snRNA-seq and snATAC–seq modalities were generated and stored as count matrices and fragment files, respectively. For quality control, nuclei were filtered based on multiple metrics: (1) RNA modality: nCount_RNA < 25,000, nFeature_RNA > 500 and mitochondrial percentage < 5%. (2) ATAC modality: transcription start site (TSS) enrichment score > 5 and nucleosome signal <2. Potential doublets were identified and removed using scDblFinder (v.1.14) based on gene expression profiles. After quality-control filtering and doublet removal, cell type annotation was performed using only the snRNA-seq modality before integration with ATAC data, as RNA counts provided higher resolution and coverage across cell types compared to ATAC profiles. Cell type identities were assigned by comparing gene expression patterns to canonical mouse cortical markers, including upper-layer neurons, deep-layer neurons, migrating neurons, callosal projection neurons, corticothalamic projection neurons, interneurons, caudal ganglionic eminence interneurons (CGEs), medial ganglionic eminence interneurons (MGEs), lateral ganglionic eminence interneurons and subcerebral projection neurons. Raw sequencing data have been deposited at the GEO under accession number GSE325427.
Human tissue dissection and processing
Donor ages spanned the mid-fetal window as defined in our previous work38. Post-conception age was calculated as gestational age in weeks minus 2 weeks. The post-mortem interval was defined as the time (in hours) between death and freezing of the tissue. Tissue dissections were performed according to established protocols38. The dlPFC was identified using known anatomical landmarks. Samples from mid-fetal period primarily comprised cortical plate and, in some cases, also included the underlying subplate.
Human tissue nucleus isolation and multiome capture
Human ~PCW18 post-mortem brain specimens were used for the 10x Genomics multiome assay (Supplementary Table 1). Nuclei were isolated according to established protocols81,82. To minimize experimental bias, frozen brain tissue was pulverized in liquid nitrogen to a fine powder using a mortar and pestle (Coorstek, 60316 and 60317) when the dlPFC region weighed more than 30 mg. Donor tissue was aliquoted into 1.5 ml tubes in portions of 10–30 mg. All buffers were prepared using molecular-grade reagents unless otherwise specified and were maintained at 4 °C until use. Then, 1 ml of lysis buffer (250 mM sucrose (Sigma-Aldrich, S0389), 25 mM KCl (Sigma-Aldrich, 60142), 5 mM MgCl2 (Sigma-Aldrich, M1028), 20 mM Tris-HCl pH 7.5 (Invitrogen, 15567-027), 0.1% Igepal (Sigma-Aldrich, I8896), 1× protease inhibitor (Roche, 11836170001 or 5056489001), 1 mM DTT (Sigma-Aldrich, 43816) and 0.08 U μl−1 RNase inhibitor (Roche, 3335402001) was added directly to each tissue aliquot and vortexed. The suspension was transferred to a prechilled dounce homogenizer on wet ice containing an additional 1 ml of lysis buffer. To recover residual tissue, another 1 ml of lysis buffer was added to the aliquot tube, vortexed and combined with the homogenizer. Tissue was homogenized using loose and tight pestles, 30 strokes each, with constant pressure and without introducing air bubbles. The homogenate was filtered through a 40 μm cell strainer (Corning, 352340) prewetted with 250 µl of lysis buffer. Then, 3 ml of iodixanol gradient buffer (25 mM KCl, 5 mM MgCl2, 20 mM Tris-HCl pH 7.5, 50% Iodixanol (Sigma-Aldrich, D1556), 1% BSA + 10× protease inhibitor (premade stock solution), 1 mM DTT, 0.08 U μl−1 RNase inhibitor) was added to the filtered homogenate, mixed by inversion ten times and centrifuged at 1,000g for 30 min in a swinging bucket at 4 °C. After centrifugation, the samples were removed, and debris and supernatant were carefully removed. The pellet was resuspended using 0.5 ml of nuclear permeabilization buffer (10 mM NaCl, 3 mM MgCl2, 10 mM Tris-HCl, pH 7.5, 0.01% NP-40 substitute (Sigma-Aldrich, 74385), 0.01% Tween-20 (BioRad, 166-2404), 0.001% Digitonin (Thermo Fisher Scientific, BN2006), 1× protease inhibitor, 1 mM DTT, 1% BSA, 1 U μl−1 RNase inhibitor) and incubated on ice for 5 min. Subsequently, 0.5 ml of wash buffer (10 mM NaCl, 3 mM MgCl2, 10 mM Tris-HCl, pH 7.5, 0.1% Tween-20, 1 U μl−1 RNase inhibitor, 1 mM DTT and 1% BSA), was added and the nucleus suspension was filtered through a 30 μm cell strainer into a new 1.5 ml tube. A small aliquot of nucleus suspension was removed for counting. The rest of the sample was centrifuged at 500g for 10 min at 4 °C. During this time, samples were counted (1:2 dilution for postnatal samples and a 1:4 dilution for prenatal samples) on a manual haemocytometer at ×20 magnification. On the basis of the calculated concentration, the samples were resuspended in resuspension solution (1× nucleus buffer from 10x Genomics ATAC Kit A, 1 mM DTT, 1 U μl−1 RNase inhibitor) in a volume that would result in approximately 8–10 million nuclei per ml. After resuspension, the samples were further filtered through a 40 μm cell strainer. Another aliquot of each sample was removed for a second round of counting to verify that the concentration of the sample fell between 3.3 and 8 million nuclei per ml, according to the 10x Genomics GEX and ATAC manual (CG000338) for 10,000 nucleus targeted capture. Single nuclei were captured according to the 10x Genomics Multiome protocol. Gene expression and ATAC libraries were prepared on the 10x Genomics Multiome platform and sequenced on the NovaSeq 6000 (Illumina) system at the Yale Center for Genomic Analysis (YCGA) to an initial depth of 250 million reads per library. Libraries flagged during quality control were resequenced to achieve a minimum of 25,000 reads per nucleus. Raw data are available at GEO under accession number GSE325427.
Human sn-multiome data alignment and processing
Sequencing data were processed using 10x Genomics Cell Ranger pipelines. Multiome libraries were first run with cellranger-ARC (v.2.0.1). To ensure optimal recovery of high-quality cells from each modality, RNA and ATAC data were subsequently processed separately: RNA libraries with cellranger (v.6.0.1) and ATAC libraries with cellranger-ATAC (v.2.0.0). For RNA, cell calling followed the barcode rank plot-based method implemented in Cell Ranger, whereas ATAC cell calling and library-level quality control were performed using the default cellranger-atac workflow.
snRNA-seq and snATAC–seq data were processed using Seurat (v.5.1.0)83, Signac (v.1.15.0)84 and scDblFinder (v.1.14) according to standardized quality-control and integration procedures. Putative doublets were identified with scDblFinder using the default settings, and clusters were annotated as doublets when they displayed mixed lineage signatures together with a doublet-score above the scDblFinder-defined 75th percentile, after which these clusters were removed from downstream analyses. Filtered RNA data were normalized using SCTransform with glmGamPoi, integrated across batches using Harmony, and subjected to PCA, UMAP and graph-based clustering before marker-based annotation. scATAC–seq libraries were processed with Signac, and high-quality nuclei were selected based on nFragments > 1,000 and TSS enrichment > 4, with extreme nucleosome signal or blacklist enrichment filtered out. Peaks were called with MACS2 on pseudobulk aggregates, gene-activity scores were computed from promoter-proximal and gene-body-extended peaks, and dimensionality reduction was performed using TF-IDF and SVD followed by Harmony correction. Multi-omic integration was achieved using Seurat’s weighted nearest-neighbour framework, aligning transcriptomic and chromatin-accessibility manifolds to generate unified clusters. Discrepant or low-quality multimodal clusters were manually inspected and removed, and final cell type annotations were assigned based on integrated RNA markers, chromatin accessibility patterns and regulatory element-to-gene linkage profiles. Cell types were annotated based on canonical marker genes, including CGEs, excitatory newborn/migrating neurons, glial intermediate progenitors, immature layer 2/3 excitatory neurons, immature layer 4/5 excitatory neurons, layer 5 extratelencephalic projection neurons, layer 5/6 near-projecting neurons, layer 6 corticothalamic neurons, layer 6 intratelencephalic neurons, layer 6b neurons, MGEs, microglia, neuronal intermediate progenitors, oligodendrocyte precursor cells and radial glia (Extended Data Fig. 1b).
Regulatory network inference in the human mid-fetal dlPFC
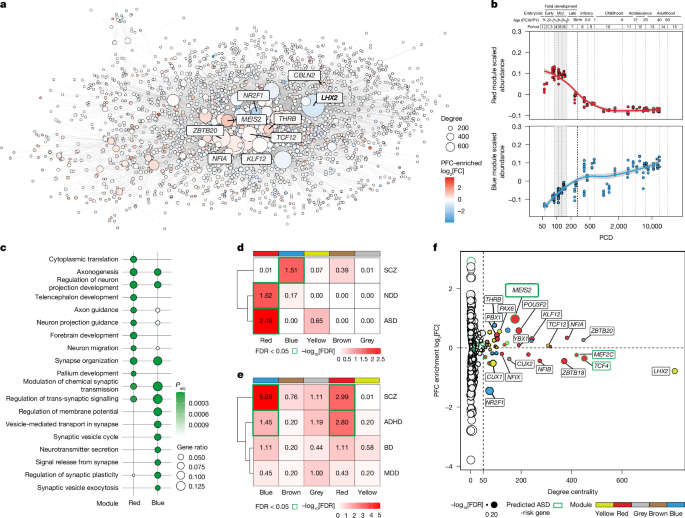
To identify TF regulatory programs, SCENIC+ (v.1.0a2)85 was applied to the sn-multiome data. Regulon activity scores were calculated per cell type, and the top enriched regulons were identified using the regulon specificity score. To refine regulatory predictions, TF–target interactions were filtered by paired chromatin accessibility profiles, retaining only motifs accessible in relevant cell populations. A TF network specific to the dlPFC was constructed by integrating SCENIC+-derived regulons with ATAC-supported motif accessibility. TF–TF interactions were extracted and visualized in R (v.4.4.1) using the igraph (v.2.0.3) and ggraph (v.2.2.1) packages. The node size was scaled by the number of regulon targets, and clusters were colour coded according to functional categories. The resulting dlPFC TF regulatory network was visualized in Extended Data Fig. 1d, and the complete TF–target table is provided in Supplementary Table 2. This network formed the basis for constructing the RA-associated regulatory network.
Nucleus isolation and CUT&Tag library
Human ~PCW19 post-mortem brain specimens were used for CUT&Tag library preparation. As transcription factor CUT&Tag depends on the preservation of native chromatin structure and protein–DNA interactions, the use of post-mortem human fetal tissue represents an unavoidable technical limitation for transcription factor profiling. Fresh frozen tissue was subjected to nucleus extraction followed by CUT&Tag library construction. Nuclei were isolated using the Minute Single Nucleus Isolation Kit for Neuronal Tissues (Invent Biotechnologies, BN-020) according to the manufacturer’s instructions, except that reagent B (myelin removal) was omitted, as myelin is sparse at mid-fetal stages and its use results in substantial nuclear loss. Pelleted nuclei were resuspended in 5% BSA and stained 1:1 with Trypan Blue (Invitrogen, T10282). Nuclei including Trypan Blue were quantified using the LUNA-II Automated Cell Counter.
For CUT&Tag-seq (Hyperactive Universal CUT&Tag Assay Kit for Illumina, Vazyme, TD903), the basic procedure was performed according to previously described methods86. Specifically, the protocol proceeded as follows: 1 × 10⁵–2 × 10⁵ nuclei were washed with 100 µl wash buffer and centrifuged at 600g for 3 min at room temperature. The nuclear pellets were resuspended in 100 µl wash buffer. Concanavalin-A-coated magnetic beads were washed twice with 100 µl binding buffer, and 10 µl of activated beads was added to the suspension and incubated for 10 min at room temperature. After incubation, the buffer was removed and bead-bound nuclei were resuspended in 50 µl antibody buffer. Primary antibodies (1 µg per 1 × 10⁵ nuclei) were added and incubated overnight at 4 °C. The following antibodies were used: RARA (Abcam, ab41934)87,88,89,90, RARB (Invitrogen, PA1-811)91, RXRG (ABclonal, A1877) and MEIS2 (Abcam, ab244267); H3K4me3 (ABclonal, A22146) and H3K27ac (ABclonal, A22077) were used as positive controls. After removing the primary antibody solution, 0.5 µg of the appropriate secondary antibody (EpiCypher, 13-0047 and 13-0048) was added in 50 µl Dig-wash buffer and incubated for 1 h at room temperature. Nuclei were washed three times with Dig-wash buffer to remove unbound antibodies. Nuclei were then incubated with 0.04 μM Tn5 transposase in 100 µl Dig-300 buffer for 1 h at room temperature, followed by three washes with Dig-300 buffer to remove excess transposase. Bead-bound nuclei were resuspended in 50 µl tagmentation buffer and incubated for 1 h at 37 °C. Tagmentation was terminated by adding 5 µl of 20 mg ml−1 proteinase K, 100 µl buffer L/B, and 20 µl DNA extract beads, followed by incubation for 10 min at 55 °C. DNA was purified using DNA extract beads. PCR amplification was used to enrich Tn5-fragmented DNA and to incorporate i5/i7 adapters (TruePrep Index Kit V2 for Illumina, Vazyme, TD202), sequencing primers, and sample indices for Illumina sequencing. Amplified products were purified with 1.2× SPRIselect reagent (Beckman Coulter, B23318) and subjected to Illumina PE150 Nova sequencing at the YCGA. Raw data are available at GEO under accession number GSE325427.
CUT&Tag data processing
Raw FastQ files were processed with fastp (v.0.23.2) to remove low-quality bases and adapter sequences. Cleaned reads were aligned to the human reference genome (GRCh38/hg38) using Subread (v.2.0.1)92. PCR duplicates, unpaired reads and low-quality alignments were removed using Sambamba (v.0.6.6)93 and SAMtools (v.1.21)94. The resulting BAM files were converted into RPKM-normalized bigWig tracks with deepTools (v.3.5.6)95 and visualized in IGV (v2.16.2)96 using the autoscale option to enable cross-sample comparison. For downstream visualization, bigWig files from replicates were merged, and peaks bound by RARA, RARB and RXRG were combined into a unified RAR–RXR set. Peak calling for H3K4me3, H3K27ac, RAR–RXR and MEIS2 CUT&Tag data was performed using three independent algorithms: MACS2 (v.2.2.9.1)97, HOMER (v.4.11)98 and LANCEotron (v.1.2.7)99, followed by reproducibility assessment with IDR (v.2.0.4.2). Corresponding consensus peak sets were merged using the following criteria: (1) for replicates, only peaks with >50% reciprocal overlap were retained by bedtools (v.2.27.1); and (2) across algorithms, only peaks identified by at least two methods were retained. For peak annotation, two complementary approaches were applied: ChIPseeker (v.1.40.0)100, which favours proximal annotation, and rGREAT (v.2.6.0)101, which favours distal annotation (Supplementary Tables 3 and 10). All genes assigned to annotated peaks were used for genome-wide analyses, including enrichment and network construction. As ligand-dependent nuclear receptors, RAR and RXR DNA binding is modulated by RA, a metabolite that is highly labile and susceptible to degradation. This biochemical property may contribute to increased background and reduced signal-to-noise ratios in RAR/RXR CUT&Tag profiles compared to MEIS2, particularly for RXRG. Despite these limitations, the identified RAR–RXR-associated peaks showed significant enrichment of canonical RAR–RXR-binding motifs (MA0730.1, MA1552.2 and MA1556.1 from JASPAR), with motif occurrences concentrated around peak summits, supporting bona fide RAR–RXR occupancy at these sites (Extended Data Fig. 1h), and enriched near genes involved in axon growth and synapse formation (Extended Data Fig. 1k–n), consistent with established roles of RA signalling23,24, supporting the overall interpretability of the dataset. For specific loci of interest, peak assignments were manually inspected using bigWig based on H3K4me3 and H3K27ac to ensure accuracy. De novo motif enrichment analysis of the merged peak sets was performed using HOMER to identify potential co-factor binding motifs.
Human mid-fetal PFC-enriched gene analysis
Independent spatiotemporal human brain RNA-seq datasets were obtained from BrainSpan (https://www.brainspan.org/)40. For the early and late mid-fetal periods38, a total of 105 mRNA samples corresponding to 11 prospective neocortical areas—including the pial surface, marginal zone, cortical plate (layers 2–6) and adjacent subplate zone—from developmental windows 2 and 4 (PCW13–22) were analysed. The neocortical regions included the orbital PFC (oPFC), dlPFC, ventrolateral PFC (vlPFC) and mPFC, as well as the M1 from the frontal lobe; the SSp and posterior inferior parietal cortex (IPC) from the parietal lobe; the primary auditory cortex (A1C), posterior superior temporal cortex (STC) and inferior temporal cortex (ITC) from the temporal lobe; and the primary visual cortex (V1C) from the occipital lobe. To identify PFC-enriched genes, neocortical areas were divided into two groups: the PFC (dlPFC, mPFC, oPFC, vlPFC) and non-PFC (M1, S1C, IPC, A1C, V1C, STC, ITC). Raw gene-level counts were analysed using edgeR (v.4.2.0)102. Low-expressed genes were filtered using filterByExpr, and library sizes were normalized using the TMM method. A design matrix with the group factor (PFC versus non-PFC) was fitted using the quasi-likelihood pipeline (estimateDisp, glmQLFit, glmQLFTest). P values were adjusted using the Benjamini–Hochberg FDR, and DEGs were defined at FDR < 0.05 (optionally with |log2[FC]| > 0.58) (Supplementary Table 4). log2[FC] values (PFC versus non-PFC) and FDR estimates from the edgeR analysis were incorporated into the dlPFC regulatory network as node-level annotations, providing an expression-based measure of PFC enrichment for each gene. Moreover, only protein-coding genes were retained for bar plot visualization (Extended Data Fig. 1o), with non-coding or poorly characterized transcripts excluded.
Construction of the RA regulatory network
The RA-GRN was constructed by integrating multi-omics datasets. First, CUT&Tag profiling of RA receptors was performed to identify downstream regulatory targets. Second, the human dlPFC regulatory network was inferred using SCENIC+, retaining only genes associated with regulatory peaks, which served as the framework for the regulatory architecture. The intersection of SCENIC+-predicted regulons with CUT&Tag-identified RA receptor targets was used to define RA regulatory interactions (at gene level). To annotate network nodes, FDR and log2[FC] values (PFC versus non-PFC) from edgeR analysis were incorporated as expression-based features. Node degree, calculated in R (igraph package), was used to represent regulatory connectivity. The integrated RA regulatory network was visualized in R using igraph and ggraph, and the complete set of regulatory interactions is provided in Supplementary Table 5.
Mouse bulk RNA-seq library and data processing
PD0 pups were used to capture early molecular changes after Meis2 deletion, before the emergence of substantial secondary effects. Brains were rapidly dissected into fresh ice-cold Hanks’ balanced salt solution (Gibco, 14175-095). The mPFC was minced and digested for 15–20 min at 37 °C in DMEM (Gibco, 10566024) containing 80 U ml−1 papain (Sigma-Aldrich, P3125) and 200 U ml−1 DNase I (Invitrogen, 18047019). Tissue was dissociated into single-cell suspension by gentle pipetting, and the reaction was quenched with DMEM supplemented with 10% FBS. Cells were passed through a prewetted 40 μm cell strainer (Corning, 352340) and pelleted at 300g for 5 min. The pellet was resuspended in DMEM containing 10% FBS, and viable cells were quantified using 0.4% trypan blue (Invitrogen, T10282) and a LUNA-II Automated Cell Counter.
RNA-seq libraries were prepared from 20,000–50,000 dissociated mPFC cells using the VAHTS Universal V10 RNA-seq Library Prep Kit for Illumina (Vazyme, NR606-01), incorporating i5/i7 adapters from the VAHTS Multiplex Oligos Set 4/5 (Vazyme, N322-01). Amplified libraries were purified with SPRIselect reagent (Beckman Coulter) and sequenced on the Illumina NovaSeq 6000 platform (PE150) at the YCGA. Raw sequencing data have been deposited at the GEO under accession number GSE325427. FASTQ files were processed with fastp to remove low-quality bases and adapter sequences. Cleaned reads were aligned to the mouse reference genome (GRCm38/mm10) using Subread. Gene-level counts were obtained with featureCounts, and differential expression analysis (Meis2-cKO versus control) was performed using DESeq2, with DEGs defined at Padj < 0.05 (optionally with |log2[FC]| > 0.58). Sex-associated genes and ribosomal-protein-related genes were excluded when generating volcano plots and bar charts for DEGs (Supplementary Table 9).
Analysis of human mid-fetal brain spatial transcriptomics
Spatial transcriptomic data were obtained from a publicly available resource63 (http://donglab.life/brainAtlas.html). For the present analysis, sections corresponding to PCW14 were selected.
Comparative transcript analysis of MEIS2
To assess the evolutionary conservation of MEIS2 across species, RefSeq transcript sequences were retrieved using the R package rentrez (v.1.2.3). Searches were performed in the NCBI Gene database for Homo sapiens, Pan troglodytes, Macaca mulatta and M. musculus, and linked RefSeq RNA accessions were obtained. Transcripts annotated as ‘PREDICTED’ or ‘non-coding’ were excluded to retain only validated protein-coding isoforms. For each retained RefSeq accession, the corresponding nucleotide sequence was downloaded in FASTA format and parsed into DNA strings using the Biostrings package (v.2.72.0). Sequences were compiled into a DNAStringSet object for multiple sequence alignment using ClustalW as implemented in the R package msa (v.1.30.0)103. The resulting alignment was converted into a phylogenetic data object (phyDat) using phangorn (v.2.11.1)104, and pairwise distances were estimated using the maximum-likelihood method (dist.ml). A phylogenetic tree was constructed using the neighbour-joining algorithm and visualized in R (v.4.4.1) with annotated branch lengths. Pairwise distance matrices and the corresponding similarity matrices were exported for downstream analysis.
Motif discovery and conservation analysis of MEIS2
Position weight matrices for MEIS2-associated binding motifs were obtained from MEME-based motif discovery analyses. Sequence logos were generated in R (v.4.4.1) using the ggseqlogo (v.0.2) package105 to visualize base-specific conservation across motif positions. For comparative motif analysis, multiple position weight matrices were imported as position frequency matrices using the motifStack (v.1.48.0) package106 and visualized as stacked logos or radial motif-based trees to assess conservation and divergence across datasets.
Comparative analysis of MEIS2 protein conservation
Protein sequences of MEIS2 orthologues from human (H. sapiens), chimpanzee (P. troglodytes), rhesus macaque (M. mulatta) and mouse (M. musculus) were retrieved from UniProt using the UniProt REST API. The first sequence entry was selected as the representative sequence for downstream analyses. Protein sequences were imported into R (v.4.4.1) as AAStringSet objects using the Biostrings package (v.2.72.0). Multiple-sequence alignment was performed using the ClustalW algorithm implemented in the msa package (v.1.30.0)103. The aligned sequences were exported in FASTA format and visualized using ggmsa (v.1.1.4)107, generating both global alignments and sequence logos highlighting conserved and variable residues. To quantify residue conservation relative to the human sequence, the alignment was converted into position-wise matrices using seqinr (v.4.2-36)108, and amino acid positions were classified as conserved or variable. Comparative heat maps were generated using ggplot2 (v.3.5.1), in which residues identical to the human sequence were coded as conserved and differences as variable. Protein structural domains of human MEIS2 were annotated from UniProt (MEIS N-terminal domain, DNA-interaction region and transcriptional activation domain), and mapped alongside sequence variability using patchwork (v.1.2.0) for combined visualization of functional domains and residue conservation. For each species, the proportion of conserved amino acids relative to human MEIS2 was quantified, providing a residue-level conservation score. Summary statistics, including total aligned sites, number of matched residues and percentage conservation, were calculated and visualized.
WGCNA
Spatiotemporal human brain exon microarray and RNA-seq datasets were obtained from BrainSpan40. Genes previously identified as RA-GRN members were extracted, and their expression values across PFC samples were used to construct a spatiotemporal expression matrix spanning fetal through ageing developmental periods (Extended Data Fig. 2a). WGCNA (v.1.72-5)109 was performed according to standard procedures. A soft-thresholding power was selected using the scale-free topology criterion. The resulting adjacency matrix was transformed into a topological overlap matrix (TOM), and genes were hierarchically clustered based on TOM dissimilarity. Co-expression modules were identified using dynamic tree cutting. Module eigengenes were calculated for each module, and their temporal trajectories across developmental stages were evaluated. Modules showing coherent temporal expression patterns were considered candidate regulatory modules associated with RA signalling in the PFC (Supplementary Table 6).
Gene set enrichment analysis of RA-GRN modules using NDD and SCZ databases
To assess whether disease-associated genes were enriched within individual modules of the RA-GRN, we performed a hypergeometric test using the set of all module genes as the background. For each module, the number of overlapping genes with the disorder-associated gene sets was compared against the expected overlap by chance, and P values were computed using the phyper() function in R, followed by multiple-testing correction using the Benjamini–Hochberg method. Modules with FDR < 0.05 were considered significantly enriched and are outlined in green in the figure. The NDD gene set was obtained from the NIMH NDD priority gene list (https://grants.nih.gov/grants/guide/notice-files/NOT-MH-24-370.html, trait including NDD), and the SCZ gene set was obtained from SZDB: A Database for Schizophrenia Genetic Research (http://szdb.org/SZDB/score.php) (Supplementary Table 7).
Weighted gene set enrichment analysis of RA-GRN modules using the SFARI-ASD database
Weighted gene set enrichment analysis was performed to assess the association between co-expression modules and ASD-related genes. Each gene was assigned an ASD relevance score based on the EAGLE score (≥0) from SFARI databases (https://gene.sfari.org/database/human-gene/) (Supplementary Table 7). Genes with missing scores were assigned a value of zero. To ensure consistency, gene symbols were harmonized between the ASD gene list and module annotations, and duplicated entries were removed. A ranked list of all expressed genes was generated based on their ASD relevance score (higher scores indicate stronger ASD association). Co-expression modules identified from transcriptomic data were treated as predefined gene sets, with each module containing all genes assigned to it. Enrichment analysis was conducted using the fgsea R package (v.1.30) with 10,000 permutations. The algorithm calculates an enrichment score for each module, representing the degree to which module genes are over-represented at the top of the ASD-ranked gene list. To correct for module size and multiple testing, normalized enrichment scores (NES) and Benjamini–Hochberg-adjusted FDR values were computed. Modules with FDR < 0.05 were considered significantly associated with ASD. The resulting NES values reflect the direction and magnitude of enrichment—positive NES indicates enrichment among high-confidence ASD genes, while negative NES indicates depletion. Leading-edge genes contributing most to each enrichment signal were extracted from the fgsea output for downstream visualization and functional analysis.
MAGMA analysis of RA-GRN modules using GWAS data of human psychiatric disorders
MAGMA (v.2.9.0)110 was used to test whether RA-GRN gene modules were enriched for common variants associated with human psychiatric disorders. GWAS summary statistics were obtained from the Psychiatric Genomics Consortium (PGC; https://pgc.unc.edu/for-researchers/download-results/) for SCZ (https://doi.org/10.6084/m9.figshare.14681220)111, bipolar disorder (https://doi.org/10.6084/m9.figshare.14671998)112, major depressive disorder (https://doi.org/10.6084/m9.figshare.14672085)113 and ADHD (https://doi.org/10.6084/m9.figshare.22564390)114. For gene-level analysis, the 1000 Genomes Project European reference panel was used to estimate linkage disequilibrium, applying the SNP-wise mean model. For gene set analysis, technical confounders including gene size, gene density, mean minor allele count and their log-transformed values were included as covariates in the regression model. Nominal P values were adjusted for multiple testing using the Benjamini–Hochberg method. Full results are provided in Supplementary Table 8.
Gene set enrichment analysis
Functional enrichment analyses were performed using clusterProfiler (v.4.12.0)115 in R. Gene lists derived from human and mouse datasets were used as the input. For human data, GO analyses were conducted using the enrichGO function and the org.Hs.eg.db annotation database (v.3.19.1). For mouse data, enrichment analyses were performed with the corresponding org.Mm.eg.db annotation database (v.3.19.1). Enrichment significance was evaluated with the Benjamini–Hochberg method to control the FDR (FDR < 0.05). Results were visualized using the barplot function in clusterProfiler.
Behavioural tests
Male mice aged 8–10 weeks were used for all behavioural experiments. All mouse lines used for behavioural experiments were maintained on the C57BL/6J genetic background. For behavioural testing, mice were group-housed under standard conditions (1–3 mice per cage) on a 12 h–12 h light–dark cycle with ad libitum access to food and water. Littermate controls were used whenever feasible; when littermates were not available in sufficient numbers, age-matched C57BL/6J controls from the same colony were used, and all mice were bred and housed under identical conditions. We performed a series of tests to assess cognitive, anxiety-related and motor behaviours in mice. Mice were acclimatized to the testing room for 30 min before the start of each experiment. The apparatus was sanitized with 70% ethanol before the first trial and with water for subsequent trials. To minimize behavioural alterations caused by ethanol scent, cage dust was rubbed on the apparatus for the initial control trial; data from this trial were excluded from analyses. Behavioural tests were performed in the order described below, with 24 h intervals between tests. Except for the nest-building test, all experiments were performed during the light phase.
Nest test
Nest-building behaviour was assessed as a measure of goal-directed and executive-function-related spontaneous activity. Adult mice were individually housed in standard home cages containing a thin layer of bedding and a single piece of pressed cotton nestlet. The test was initiated at the beginning of the dark phase (around 18:00), and animals were left undisturbed for 16 h. At the end of the testing period (at about 10:00 the next day), each cage was photographed, and the remaining intact nestlet and the constructed nest were evaluated. Nest-building performance was scored according to a six-point scale modified from a previously described nest-scoring system116: 0, nestlet untouched (>90% intact); 1, nestlet partially shredded (50–90% intact); 2, nestlet mostly shredded but no identifiable nest (<50% intact, flat); 3, nestlet shredded and partial nest with defined walls; 4, nearly perfect nest with a crater-like structure and walls over half of mouse height; 5, fully enclosed nest with a complete dome and entrance hole.
Y-maze test
Mice were placed at the centre of the Y-maze and allowed to explore freely for 5 min. Arm entries were recorded using Noldus EthoVision XT software (v.15). Spontaneous alternation (%) was calculated as the ratio of successive entries into three different arms divided by the total number of possible alternations (total entries – 2).
Open-field test
Mice were placed in the centre of a rectangular arena (40 cm × 40 cm) and allowed to explore freely for 10 min. Movement was recorded using Noldus EthoVision XT software (v.15), which automatically tracked distance travelled, velocity and time spent in centre versus periphery zones. Reduced time in the centre and increased time in the periphery were interpreted as elevated anxiety-like behaviour.
Statistical analysis and reproducibility
All data are presented as mean ± s.e.m. and were analysed using Prism v.10.1.2 (GraphPad Software). Comparisons between two groups were performed using a two-sided unpaired Student’s t-test or a two-sided Fisher’s exact test, as appropriate. Comparisons among three or more groups were performed using a two-sided ordinary one-way ANOVA or a two-sided repeated-measures two-way ANOVA, followed by Tukey’s or Šidák’s multiple-comparisons test, as appropriate. P < 0.05 was considered statistically significant. All representative images shown in the figures were obtained from experiments independently repeated with similar results, unless otherwise stated. The number of independent experimental repetitions for each experiment is provided in the corresponding figure legends or described below. Biological replicate numbers, statistical analyses, test statistics, degrees of freedom and exact P values are provided in the corresponding figure legends and Supplementary Table 11. Some data shown in the figures are representative rather than quantified, including RNA-expression patterns, or derive from scarce tissue sources, particularly fetal human and macaque tissue. For representative micrographs of mouse tissue, experiments were performed two or more times. For fetal macaque and human micrographs, each experiment was performed using one biological sample. The scarcity of fetal human and macaque tissue precludes robust replication across samples and is an inherent limitation of studies using these tissues.
Manuscript preparation
All text was written by humans. The manuscript was written by L.Y. and N.S. with edits and suggestions from all of the authors. In editing the manuscript text, ChatGPT (https://chatgpt.com) and Grammarly (https://www.grammarly.com) were used for proofreading and style suggestions. Adobe illustrator 2023 and Adobe Photoshop 2023 were used to assemble all of the figures.
Reporting summary
Further information on research design is available in the Nature Portfolio Reporting Summary linked to this article.
Keep following us for the latest insights.