
John Hussman doesn’t move. The famous permabear, best known for calling out the dot-com bust, remains unfazed by his prediction of a big stock crash to come. He says there are a handful of warnings suggesting markets have reached a “speculative extreme” that possibly even exceeds the years before 1929 and 2000. Overall, signs point
John Hussman doesn’t move.
The famous permabear, best known for calling out the dot-com bust, remains unfazed by his prediction of a big stock crash to come. He says there are a handful of warnings suggesting markets have reached a “speculative extreme” that possibly even exceeds the years before 1929 and 2000.
Overall, signs point to a S&P 500 decline of up to 75% in the coming years, Hussman wrote in a client note this week, a slightly more catastrophic view than his previous prediction that the stock could suffer a 70% drop.
It’s possible the benchmark could withstand a smaller loss of 55%, assuming the profit margins big companies have made over the past decade are permanent, he said.
“The current level of stock market valuations remains easily the most speculative extreme in American financial history,” Hussman wrote.
Hussman is known for regularly speculating on apocalyptic declines in markets, and he persists in his call even as stocks have posted double-digit annual gains in recent years. He pointed to a handful of signs that justify his downside risk estimate:
1. “Extreme” ratings

Hussman Strategic Advisors
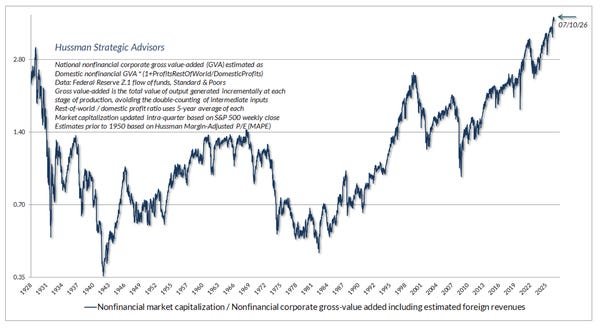
The stock looks extremely expensive from a historical perspective. The ratio of non-financial market capitalization to gross value added, which Hussman called his “most reliable gauge” of market valuation, is now at the highest level ever recorded, surpassing its peak in the years before the 1929 crisis, he said.
“In past market cycles, the gap between prevailing valuations and historical norms has generally closed, which is part of the reason why our baseline risk estimate for the S&P 500 is a loss of around 75%,” he said, adding that the same indicator was what led him to project an 83% loss before the Internet bubble burst.
Adjusting for average nonfinancial profit margins, the S&P 500’s 12-year average annual nominal total return when valuations were at this level is around 0%, according to Hussman’s analysis.
2. Corporate profits appear boosted by deficits

Hussman Strategic Advisors
Corporate profits have been strong, but there are signs that profits are being boosted by large government and American household deficits.
Corporate free cash flow, a reflection of how profitable companies are, appears to be a “reflection” of the combined deficit between the U.S. government, households and foreign trading partners, he said, citing his firm’s analysis of Bureau of Economic Analysis data.
“When we consider the fact that almost 90% of corporate stock is owned by the richest 10% of households, and that the other 90% finance their deficits by issuing liabilities such as consumer debt that are accumulated directly or indirectly by the richest 10%, we see very clearly that the wealth enjoyed by one group is a reflection of the income deficits of others,” he said.
3. Margin debt is at the extremes

Hussman Strategic Advisors
More investors are borrowing money to invest, another sign of “speculative exuberance” in the market, Hussman said.
The debt margin to GDP ratio is approaching 4.5%, the highest level ever recorded.
Historically, sharp spikes in the ratio have been followed by sharp declines in the market, as was the case leading to the dot-com crash, the Great Financial Crisis and the bear market in 2022, Hussman noted.
4. IPO Frenzy
The hype over companies soon to go public is another red flag, Hussman said. Based on currently estimated valuations, companies expected to go public this year are worth about 12% of total U.S. GDP, he said.
IPO proceeds have already hit a record high in 2026, with newly listed companies raising a combined $142.4 billion. That’s up 792% from last year’s levels, according to data from Renaissance Capital.
“History has always taken today’s speculative exuberance to much more worrying conclusions,” Hussman said of the fate of the stock bubble.