Expression and purification of SC003-mi3 VLP The mi3-VLP (also known as SC003-mi3) was derived from i3-01 (ref. 66) by introducing two mutations that remove surface-exposed cysteines to prevent aggregation and by genetically fusing a SpyCatcher domain to the N-terminus to enable plug-and-play attachment of SpyTagged proteins54. The plasmid pET28a-SpyCatcher003(SC003)-mi3 (gift from Professor Mark Howarth, Cambridge University)
Expression and purification of SC003-mi3 VLP
The mi3-VLP (also known as SC003-mi3) was derived from i3-01 (ref. 66) by introducing two mutations that remove surface-exposed cysteines to prevent aggregation and by genetically fusing a SpyCatcher domain to the N-terminus to enable plug-and-play attachment of SpyTagged proteins54. The plasmid pET28a-SpyCatcher003(SC003)-mi3 (gift from Professor Mark Howarth, Cambridge University) was transformed into Escherichia coli BL21(DE3) RIPL cells (Agilent) and plated on Luria-Bertani (LB) agar supplemented with 50 µg ml−1 kanamycin. After incubation for 16 h at 37 °C, a single colony was used to inoculate 10 ml LB media containing 50 µg ml−1 kanamycin and grown overnight at 37 °C with shaking at 200 rpm. This starter culture was transferred into 1 l LB medium with the same antibiotic and incubated at 37 °C, 200 rpm, until the OD600 reached about 0.6. Protein expression was then induced with 0.42 mM IPTG and cultures were grown for a further 16 h at 22 °C with shaking (200 rpm). Cells were collected by centrifugation at 4,000 × g for 15 min. Cell pellets were resuspended in 40 ml lysis buffer (20 mM Tris-HCl, 300 mM NaCl, pH 8.5 at 4 °C) containing 0.1 mg ml−1 lysozyme, cOmplete EDTA-free protease inhibitor cocktail (Roche, 1 mg ml−1) and 1 mM PMSF. The suspension was passed through a high-pressure homogenizer (Constant Systems) at 30,000 psi, with 2–3 passes on ice. The lysate was clarified by centrifugation at 35,000 × g for 45 min at 4 °C and the supernatant was collected. Ammonium sulfate was then added at 170 mg/ml of lysate and the mixture was incubated at 4 °C for 1 h with agitation (220 rpm) to precipitate the particles. Following centrifugation at 30,000 × g for 35 min at 4 °C, the pellet was resuspended in 8 ml buffer (25 mM Tris-HCl, 150 mM NaCl, pH 8.0 at 4 °C) and passed through 0.22-µm filters (Croning). The filtrate was dialysed overnight against a 500-fold excess of the same buffer at 4 °C. Dialysed material was centrifuged at 17,000 × g for 30 min at 4 °C to remove insoluble aggregates and filtered again (0.22 µm). Purification was completed by size-exclusion chromatography on a HiPrep Sephacryl S-500 HR 16/60 column (GE Healthcare) equilibrated in 25 mM Tris-HCl, 150 mM NaCl, pH 8.0 at 4 °C, using an ÄKTA Pure 25 system (GE Healthcare). Elution was performed at 1 ml min−1, collecting 1-ml fractions. Fractions containing SpyCatcher003-mi3 nanoparticles were pooled, concentrated and dialysed into TBS 25 mM Tris-HCl, 150 mM NaCl, pH 8.0 at 4 °C using a 100-kDa MWCO centrifugal filter (Millipore) and stored at −80 °C. Final protein concentration was determined by BCA assay (Pierce, Thermo Fisher Scientific).
Solution self-assembly experiments
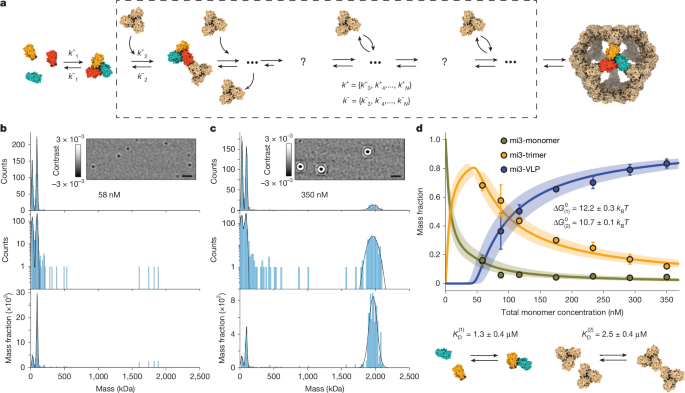
It was shown previously66 that mi3-VLPs can reversibly disassemble and reassemble at guanidinium thiocyanate concentration of 2.5 M. To perform the assembly experiments, we started with a solution containing purified mi3-VLPs (Supplementary Fig. 1) at an mi3-monomer concentration of 84 μM and disassembled the VLPs using 2.5 M of guanidinium thiocyanate at varying mi3-monomer concentrations ranging from 35 to 5.8 μM. Following an incubation time of 30 to 60 min at room temperature, assembly was initiated by rapidly diluting the protein solution 100-fold in assembly buffer (20 mM HEPES pH 7.4, 138 mM NaCl) to a final mi3-monomers concentration ranging between 350 and 58 nM. The assembly reactions equilibrated at room temperature for an extra 30 min. We quantified the distribution of masses of the reassembled VLPs at the chosen concentrations using a standard MP landing assay.
MP measurements in solution
The equilibrated assembly reactions (Fig. 1 and Supplementary Figs. 2 and 3) were measured using a commercial mass photometer (TwoMP, Refeyn Ltd.) using an imaging field of view of 4.3 × 10.9 μm2. Measurements were conducted on microscope glass coverslips (24 × 50 mm, Menzel Gläser, VWR 630-2603) that were pre-cleaned by three consecutive 5-min cycles of bath sonication in acetone, 50% isopropanol in Milli-Q water (18.2 MΩ cm) and Milli-Q. Cleaned coverslips were then dried using nitrogen flow and 3-mm silicone gaskets (GBL103250, Grace Bio-Labs) were attached to the coverslip surface. The gasket was prefilled with 15 μl of buffer and the focus position was adjusted for maximum contrast before adding 5 μl of protein solution. Measurements were performed at a frame rate of 500 Hz followed by frame binning of 2, resulting in an effective frame rate of 250 Hz. We analysed data using DiscoverMP v2024R1 (Refeyn Ltd.), in which rolling ratiometric videos were generated using an averaging window size of 20 frames (80 ms). Threshold parameters for particle detection were set to the default values of 1.5 (threshold 1) and 0.25 (threshold 2). For each dataset, a calibration of ratiometric contrast to mass was performed using a protein standard while using the same acquisition parameters, similar to a previously reported procedure60,67.
SLB preparation
SLBs were prepared using a similar procedure as previously reported, with small modifications21. In short, phospholipid stocks in chloroform were mixed to form a 5 mM stock solution with a molar composition of 0.05 mM DGS-NTA, 0.1 mM 18:1 PEG550 and 4.85 mM POPC. The stock solution was stored at −20 °C. Before use, 50 μl of the lipid stock solution was added to 200 μl of chloroform in a clean glass tube. The chloroform was evaporated by manually rotating the tube while applying a weak flow of nitrogen, followed by 1 h of evaporation under vacuum. Lipids were hydrated by adding 0.5 ml of buffer (20 mM HEPES pH 7.4, 150 mM KCl), followed by two cycles of 20-min incubation in a 40 °C water bath, mixing between each cycle. The sealed tube was left at ambient room temperature for at least 2 h or overnight. The hydrated lipids were tip-sonicated in a 1.5-ml Eppendorf tube using a 2-mm tip probe at 30% power and 1 s pulse duration separated by 3 s waiting time for a total of 10 min sonication time (Vibra-Cell, Sonics & Materials). During sonication, the tube was kept in ice water. The sonicated lipids were centrifuged at 21,130 × g for 30 min at 4 °C, before taking 0.4 ml of the supernatant. Cleaned coverslips were treated with oxygen plasma for 5 min at 40% power and 0.6 mbar oxygen pressure (Zepto plasma cleaner, Diener Electronic). Immediately after plasma cleaning, a silicon gasket (GBL103280, Grace Bio-Labs) was placed at the centre of the coverslip and 30 μl of buffer (20 mM Tris pH 7.8, 150 mM NaCl, 2 mM MgCl2) followed by 20 μl of lipids were added and thoroughly mixed in the gasket and SLB formation was allowed for about 20 min. After examining the SLB integrity, excess vesicles were washed from the surface with assembly buffer.
Preparation of the histidine tag mi3-VLPs for measurements on SLB
Spytag-polyhistidine peptide (Spy-hist) at a concentration of 270 μM in DPBS was mixed with an 84-μM solution of mi3-VLP (total mi3-monomer concentration) at a volume ratio of 2:1, resulting in a large excess of the Spy-hist peptide (180 μM versus 27 μM) and the mixture was incubated on ice for 3 h. Following incubation, the solution was filtered through a 4-ml, 100-kDa MWCO centrifugal filter (Amicon) at 4,000 × g eight times to remove the excess peptide. For each round of centrifugation, the 4-ml initial solution was concentrated to 0.1 ml. This resulted in an estimated dilution factor for the excess of Spy-hist peptide of 109. To tether the subunits to the SLBs, the tagged VLPs were disassembled by diluting 1 μl of the tagged VLP solution into 50 μl of 2.5 M of guanidinium thiocyanate. After about an hour, the disassembled VLPs were rapidly diluted 100-fold into 20 mM HEPES pH 7.4, 138 mM NaCl (assembly buffer). The final concentration of tagged mi3-monomers is estimated to be 5 nM, which is much lower than the critical concentration for VLP formation. MP measurements validated the existence of only mi3-monomers and mi3-trimers in solution, before addition as a solution on top of the SLBs.
Dynamic MP acquisition and data analysis (Figs. 2 and 3)
Data acquisition. Dynamic MP measurements of the two-dimensional assembly reactions of the pentagonal face were performed on a commercial mass photometer (OneMP, Refeyn Ltd.). We used the ‘medium’ field of view (6.3 × 9.9 μm2) at the maximum frame rate of 540 Hz and a metapixel size of 77.35 nm after 4 × 4-pixel binning. After frame averaging (two frames), the effective frame rate was 270 Hz. Following the formation of the SLB, 2 nM of tagged subunits were added to the gasket. Through different incubation times, the density of trimeric mi3-subunits was controlled. When the desired density of particles was obtained, the solution was replaced with assembly buffer at least five times, washing away soluble mi3-subunits, and the system was allowed to equilibrate for 30 min. For characterizing the thermodynamics (Fig. 2), after equilibration, between 3 and 15 60-s-long MP videos were acquired to collect enough statistics of particle trajectories, depending on the particle surface density. Each video was recorded at a different area of the SLB. Before each acquisition, the microscope stage was adjusted to the optimal focus position. Before the acquisition of each dataset, a protein standard was measured to calibrate the contrast to mass conversion using the same acquisition parameters.
Image analysis. Videos were analysed using a custom-written Python package modified from a previously published version21. In short, video processing is divided into three steps: image processing, particle detection and contrast fitting. For image processing, each frame of the 60-s video at 270 Hz was normalized to the total detected photoelectron count. To detect the local reflectivity changes originating from light scattered by the diffusing proteins on the SLBs, we subtracted the constant background of the underlying glass roughness by applying a moving median ratiometric imaging analysis approach21,60. We chose a 2.2-s time window for the moving median, suitable for the expected masses and diffusion coefficients of the tethered proteins. To suppress low-spatial-frequency intensity modulations, originating from rapid laser scanning of the imaged area, we convoluted each frame with a spatial median kernel of size 15 × 15 pixels and divided the ratiometric frame accordingly. The results of these image-processing operations are images similar to the representative frame in Fig. 2b. For particle detection, individual particles were detected above the intrinsic noise of the SLB by cross-correlating each frame with a 13 × 13-pixel kernel of the experimentally obtained point spread function (ePSF) of individual proteins. The ePSF was calculated by averaging individual PSFs of multiple glass binding events of a monodisperse protein solution. Template detection was applied using the match_template function from the scikit-image Python package. A cut-off value for template matching was set to 0.4. Only pixels whose value was higher than the cut-off values and that were identified as local maxima within a spatial window of 4 × 4 pixels were considered as detection events. For contrast fitting, each candidate pixel then serves as the centre of a region of interest (ROI) of size 11 × 11 pixels and the initial guess for the fitting procedure. The contrast of the detected particle was extracted by fitting the x,y coordinates of the centre of the experimentally normalized (to 1) interpolated ePSF. The x,y positions were found by minimizing the square difference between the defined ROI around the detected particle and the ePSF shifted to the x,y position. The minimized function is given by
$$Keep following us for the latest insights.^Check back often for more exciting news!=\mathopKeep following us for the latest insights.\limits_For more tech updates, stay tuned to our blog.{(c(x,y)\times {\rm{ePSF}}{(x,y)}_{i,j}-{{\rm{ROI}}}_{i,j})}^{2},$$
(1)
in which i,j are the indices of the ijth pixel of the ROI and c(x,y) is a scaling factor of the normalized ePSF that minimizes the R2 value at a given x,y position. cmin(xmin,ymin) is the reported measured contrast of the protein/complex. The best fitted contrast at each iteration is given by
$$c(x,y)=\frac{{\Sigma }_{i,j}{\rm{ePSF}}{(x,y)}_{i,j}\times {{\rm{ROI}}}_{i,j}}{{\Sigma }_{i,j}{\rm{ePSF}}{(x,y)}_{i,j}^{2}}.$$
(2)
Generating a trajectory from consecutive localizations. Individual successful and consecutive fitting events across adjacent frames were connected into a single molecular trajectory using the same code published and explained previously21 using the trackpy Python package.
Segmenting trajectories using step detection. To segment each molecular trajectory to its specifically sampled oligomeric states, separated by 120 kDa, for better mass resolution on the histogram level, characterization of the thermodynamic (Fig. 2) and for calculation of the average transitions kinetics, we implemented a step detection algorithm68. We combined this implementation with a step size threshold of 50 kDa, which is much lower than the known steps of approximately 120 kDa owing to trimer additions and is slightly higher than the noise introduced by the bilayer interface (about 40 kDa standard deviation at 270 Hz). Specifically, the extra mass threshold introduced was used to avoid detection of small mass changes that result from lateral movement of particles during frame acquisition, leading to different blurring of the PSF and therefore to small contrast variations. Given the intrinsic bilayer noise level of about 40 kDa at a frame rate of 270 Hz and our interest in resolving transitions between known measured masses at raw frame rate, we found this threshold to be suitable. This was confirmed by simulated data of a known transition rate (Extended Data Fig. 2). Only trajectories longer than 20 frames (74 ms) were considered for segmentation, for which shorter trajectories (<20 frames) were considered without segmentation. The minimum segment was restricted to three frames (11 ms).
Extraction of oligomeric mass and diffusion coefficient. For calculation of the diffusion coefficient, all detected trajectories and molecular segments were considered similarly. The diffusion coefficient was calculated as previously reported21, for trajectories longer than ten frames (37 ms). For shorter trajectories, we did not include a measure of the mobility. The molecular mass of each trajectory or segment was calculated by the median value of the mass trajectory. For a given diffusion coefficient, the assigned mass was corrected to take into account the motion blur that smears the detected and fitted PSF. This smearing effect lowers the fitted contrast by several percent, depending on the diffusion coefficient of the protein and the mass. The blur correction was validated both experimentally and with simulations for different masses, diffusion coefficients and acquisition parameters, as described previously21,60. The masses of molecular trajectories to which a diffusion coefficient was not assigned were not corrected.
Plotting mass histograms and calculating surface molar fractions. To calculate the surface densities of different oligomeric species, we generated weighted mass histograms from the trajectory dataset. To avoid noise detection at lower masses, we considered only trajectories longer than ten frames (37 ms); short segments of long trajectories were included even if their length was shorter than ten frames. The contribution of each mass trajectory or segment was weighted by its length and the final histogram was divided by the total number of frames per video and by the detected area. This results in a mass histogram in which the y-axis represents the average number of detected molecular species per detected area (or surface density). The histograms (Fig. 2) were then fitted to a series of five Gaussian functions for the five oligomeric species, from one mi3-trimer to the pentagonal ring. The surface density of each oligomer was multiplied by the number of its trimeric subunits and the total surface density of trimers was calculated by the sum of all oligomers. Following normalization, the molar fraction of mi3-trimers in each oligomeric state is given by
$${X}_{n}=\frac{n{\rho }_{n}}{{\sum }_{n}n{\rho }_{n}},$$
(3)
in which Xn is the molar fraction of mi3-trimers in an oligomer of size n trimers and ρn is the surface density of this oligomer.
Measurements and detection of mass changes. To quantify the dissociation rate constant of the dimer and trimer of mi3-trimers (\({k}_{{\rm{off}}}^{{\rm{dimer}}},{k}_{{\rm{off}}}^{{\rm{trimer}}}\)), we performed three dynamic MP experiments at trimer surface densities of 0.25, 0.34 and 0.72 μm−2. The experiments were performed as described above, by adding 2 nM of hist-tag mi3-subunits on top of the SLB. Following an equilibration time of 30 min and for each bilayer, we consecutively measured 30 different areas on the SLB, each area of dimensions roughly 6.3 × 9.9 μm2, for 1 min and at an effective frame rate of 270 Hz. The detected molecular trajectories were analysed and segmented as described above. Following segmentation, segments attributed to dimeric and trimeric oligomers were defined as all mass traces whose median mass falls within the experimental range given by the overall mass distribution of the corresponding oligomer. Dissociation events for dimers or trimers were defined as any mass change during the molecular trajectory in which the final mass is lower than the initial mass and that the absolute mass change is larger than 50 kDa. Theoretically, direct analysis of the resulting distribution of dwell times before dissociation will provide information on the dissociation constant. However, this analysis is prone to several statistical and experimental biases, including: early termination of trajectories owing to particles leaving the field of view, termination of molecular trajectories owing to identity switching (wrong trajectory linking results from close proximity of particles below the diffraction limit) and mass fluctuations resulting from close proximity of particles that do not interact. We therefore focus our analysis on the calculation of the average observed transition rate. Here <rij> is the average transition rate from an oligomeric state i to any oligomeric state j, in which mj < mi, and m is the measured mass. Taking the inverse of this rate, τij = <rij>−1, represents the average characteristic timescale for disassembly of oligomer, i, or the average dwell time before disassembly. Calculation of the average dissociation rate for the ith oligomer, <ri> follows
$$ < {r}_{i} > =\frac{{\sum }_{j < i}{N}_{{ij}}}{{\sum }_{k}{t}_{i,k}}=\frac{{N}_{{\rm{diss}}.}^{(i)}}{{T}_{{\rm{total}}}^{(i)}}$$
(4)
Here Nij is the number of detected transitions from state i to state j, in which mj < mi, and ti,k is the total observation time of the kth segment of state i. Therefore, the average is given by the total number of disassembly events, \({N}_{{\rm{diss}}.}^{(i)}\), divided by the total observation time, \({T}_{{\rm{total}}}^{(i)}\). An example of the calculation for a representative trace is shown in Extended Data Fig. 3. The average dissociation rate was calculated for the dimeric and trimeric states for each 1-min dynamic MP video and converted to the average lifetime, τi = <ri>−1. A distribution of the 30 measured average lifetimes for the two oligomers is shown in Supplementary Fig. 5. The average lifetimes across different surface densities are shown in Fig. 2 (inset). Also, because for two-dimensional reactions the rate constant depends on the local distribution of proteins, the ratio of the average lifetimes of the dimer and trimer per video was calculated as well, as shown in Extended Data Fig. 2.
Dynamic MP measurements (Fig. 3)
Data acquisition. Dynamic MP measurements of solution bulk assembly kinetics from tethered pentamers (Fig. 3) were performed on the same commercial mass photometer (OneMP, Refeyn Ltd.). Here acquisition used a custom field of view of size 15.4 × 13.2 μm2 to allow maximum statistics and a frame rate of 250 Hz for maximum temporal resolution. Each measurement corresponds to acquiring a 60-s video. No further averaging was applied. Following the formation of the SLB and washing excess vesicles from the surface, 2 nM of tagged subunits were added to the gasket. The density of mi3-trimers was controlled by the incubation time. The solution of the tagged mi3-subunits was replaced with assembly buffer at least five times, washing away subunits in solution, and the system was allowed to equilibrate for 30 min to allow formation of pentamers on the surface. The initial mass distribution was measured and the assembly reaction was initiated by adding an equilibrated solution of the reassembled, untagged-mi3-VLPs at total protein concentrations of 88, 44 and 29 nM. The added solution of equilibrated VLPs does not contain the histidine tag modification and therefore particles do not bind the SLB (Supplementary Figs. 5 and 18) and bind surface-assembled pentamers instead. The assembly process of surface pentamers into fully assembled VLPs was monitored by acquiring consecutive 1-min videos, each at a different area of the SLB and for approximately 40 min per technical repeat. At each assembly condition, we repeated the experiment three times. For each repeat, a new SLB was formed and the above procedure was followed. Each repeat of assembly measurements represents a kinetic measurement of approximately 1,000 particles (about 20–30 particles per measurement multiplied by approximately 30–40 time points).
Analysing trajectories to extract mass distributions. Mass histograms of the dynamic MP experiments shown in Fig. 3 and Supplementary Figs. 10–17 were processed in the same way as described above, with only one extra step. The approximately four times larger field of view used here to increase statistics results in small optical contrast inhomogeneities across the imaged field of view. To quantitatively correct these small variations (several percent), we performed a standard MP experiment (similar to the procedure described above for a landing assay on a glass surface) using citrate synthase protein, a monodisperse protein calibrant with a known mass. Using this calibrant, we constructed a two-dimensional map of relative variations of the measured mass as a function of the x,y position across the imaged field of view (Supplementary Fig. 9). Following the fitting stage, we used this map to correct each measured particle contrast according to its fitted x,y position. Because the corrected mass is a constant function related to the microscope, the same correction was used for all of the measurements that correspond to the same size of the field of view. The experimentally calibrated relative contrast variation is shown in Supplementary Fig. 9.
Single-complex assembly experiments
Coverslip preparation and photolithography. Confined SLBs were prepared using a previously published protocol69,70, with modifications as detailed in ref. 53. Briefly, glass coverslips were cleaned as described above. Following plasma cleaning, the coverslips were rinsed with Milli-Q water, dried with nitrogen and fitted with silicone gaskets. The gaskets were filled with 50 µl of 2 µg ml−1 PLL(20)-g[3.5]-PEG(2) (SuSoS Surface Technologies) and incubated for 30 min at room temperature. After incubation, the coverslips were rinsed with Milli-Q water, dried with nitrogen and exposed to deep ultraviolet light using a mask aligner (Suss MJB4, HgXe 500 W source) for 60 min through a custom-made chrome photolithography mask containing an array of 5-µm-diameter circles. Finally, the coverslips were rinsed with Milli-Q water, dried with nitrogen and stored at −20 °C for up to three months before use.
Data acquisition. Patterned supported SLBs were prepared using the photolithographically patterned glass coverslips and the SLB preparation procedure. Formation of surface pentamers confined to the SLB followed a similar protocol as described above. For assembly from pentamers to full VLPs, an equilibrated solution of preassembled untagged-mi3-VLPs at total mi3-monomer concentrations of 88 or 100 nM was added on top of the confined pentamers. The focus position was then found and the confined SLBs were measured for 5 min from the time of solution addition using a OneMP with a field of view of size 15.4 × 13.2 μm2.
Data analysis. We carried out data analysis in the same manner as for standard dynamic MP analysis (see above), with an extra step for correcting long tracking of single assembled VLPs in the case in which more than one pentagonal ring complex was confined in the same trap. After automatic trajectory linking, resulting trajectories were further manually examined and linked using frame, position and contrast values. In several cases, slower mobility of particles close to the edge of the trap affected the ratiometric contrast, owing to the median background subtraction, and we manually found periods in which the VLPs did not move and reanalysed these with a modified version of ratiometric analysis in which the background is estimated using interpolation of the raw images from 250 frames before immobilization to 250 frames after immobilization. For longer immobilization periods, in which the modified ratiometric analysis could not overcome sample drift, we did not consider the mass measurements from the corresponding frames (Supplementary Fig. 21). The contrast values of the initial pentameric rings were converted to mass by aligning the initial contrast values (first 10 s) to the expected pentamer mass, following calibration of the mass to contrast conversion for the same acquisition settings.
Mass trajectories analysis. We performed dwell times analysis using the same step detection procedure described above to identify transitions between molecular states, with a threshold of 70 kDa. The resulting trajectories are shown in Supplementary Figs. 19 and 20. The molecular states were defined according to their expected masses (Supplementary Fig. 19, projected histograms) with a possible error of up to 5% owing to variations in the contrast to mass conversion as a result of variation in focus position. The trajectories and molecular transitions were also examined manually to validate the transition times between stable intermediates. In cases where a molecular state was not detected in a particular mass trace, its dwell time was set to 0.
{For more tech updates, stay tuned to our blog.|Keep following us for the latest insights.|Check back often for more exciting news!}